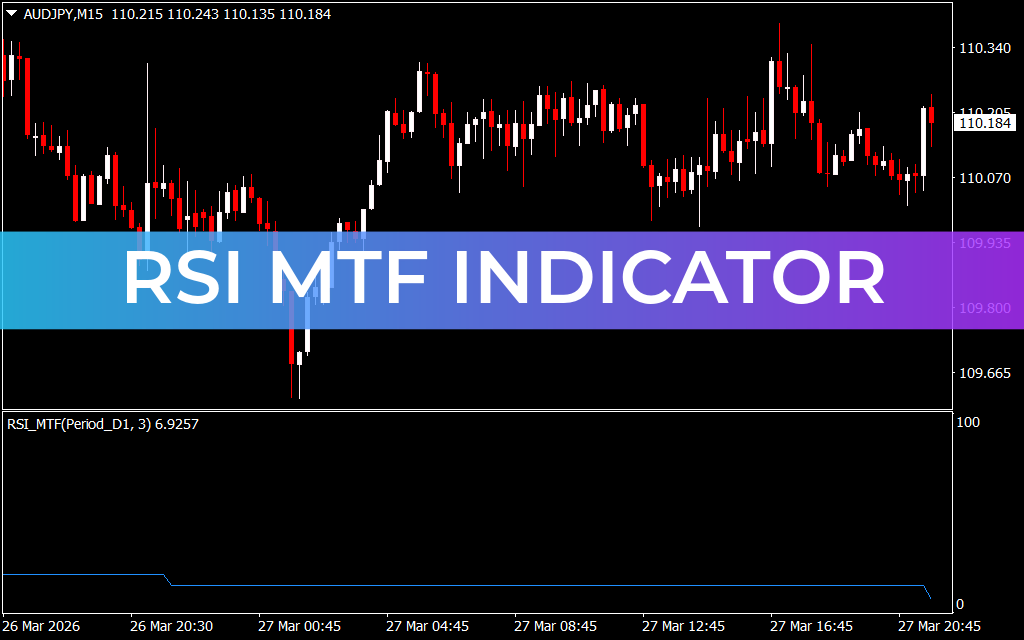
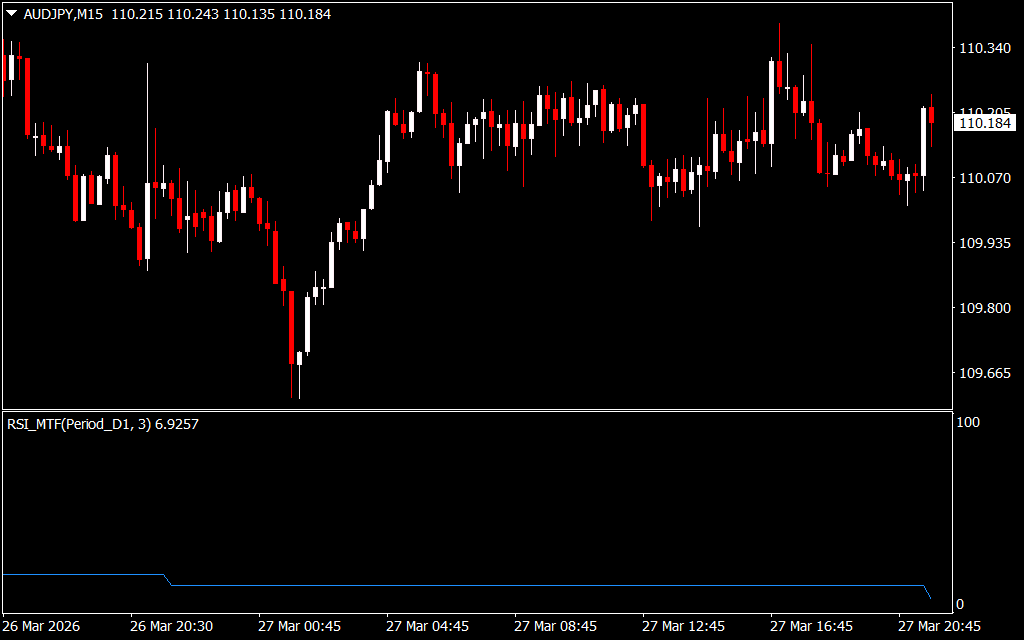
The RSI MTF Indicator for MT4 is an advanced version of the classic Relative Strength Index (RSI). It allows traders to view RSI values across multiple timeframes on the same chart, giving a broader perspective on market momentum and overbought or oversold conditions.
Key Features of RSI MTF Indicator
- Multi-Timeframe Analysis: Monitor RSI readings from different timeframes simultaneously.
- Overbought/Oversold Alerts: Quickly identify potential reversal points across charts.
- Momentum Insights: Assists in spotting trends and price corrections using RSI.
- MT4 Compatibility: Works seamlessly on all intraday and higher timeframe charts.
How to Use RSI MTF Indicator
The RSI MTF Indicator enhances technical analysis by providing a comprehensive view of momentum:
- Identify Overbought Conditions: If the RSI on higher timeframes (e.g., H4) is overbought, avoid entering long trades on smaller timeframes.
- Identify Oversold Conditions: If the RSI on multiple timeframes is oversold, it may indicate a potential buying opportunity.
- Trend Confirmation: Align trades with higher timeframe trends to improve accuracy and reduce false signals.
By considering RSI readings across multiple timeframes, traders gain a better understanding of the overall market context, preventing narrow-scope errors and improving trade decisions.
Why Traders Use RSI MTF
The RSI MTF Indicator is ideal for traders seeking multi-timeframe momentum insights. It allows both new and advanced traders to make informed trading decisions by combining intraday setups with higher timeframe analysis.
Conclusion
In summary, the RSI MTF Indicator for MT4 provides a complete view of market momentum across timeframes. By highlighting overbought and oversold conditions on multiple charts simultaneously, it helps traders make more informed and precise trading decisions.
FAQ
Published:
Mar 27, 2026 19:39 PM
Category: