Free
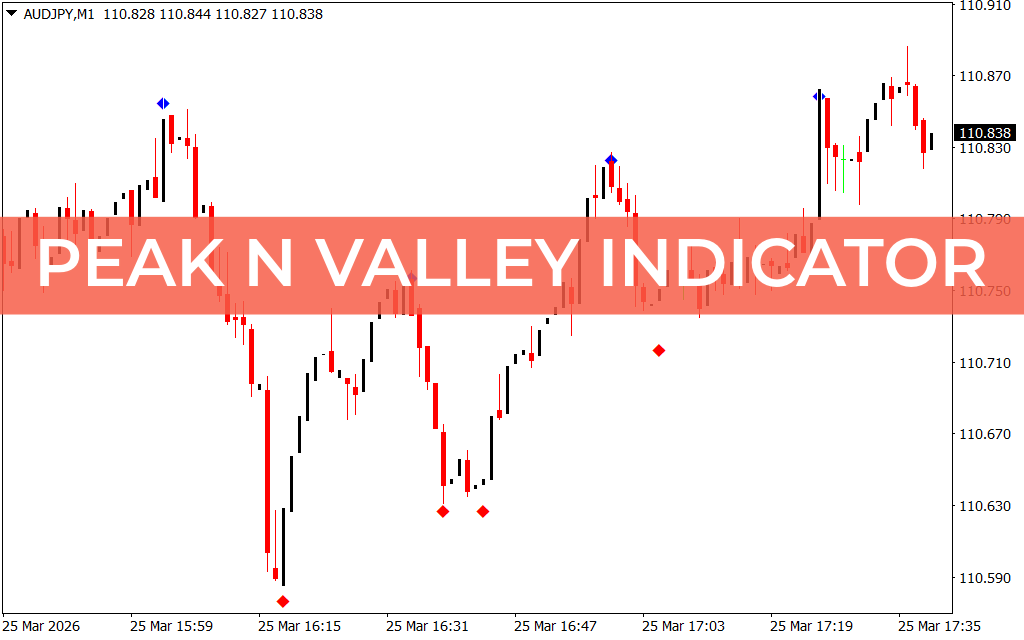
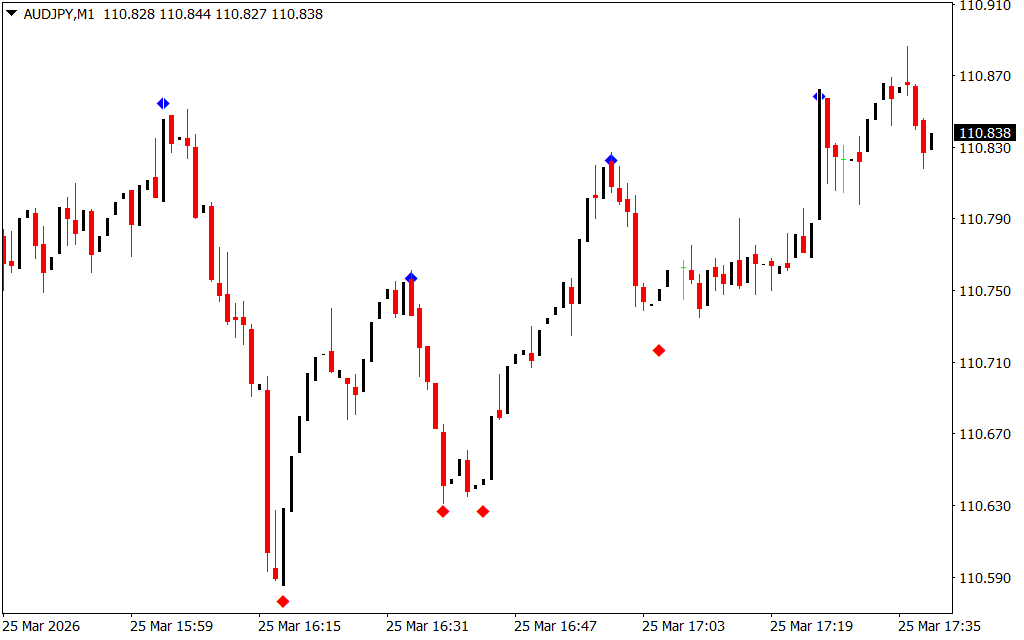
The Peak N Valley indicator for MT4 is a reversal-based Forex trading tool that identifies high-probability buy and sell opportunities. It automatically detects price reversals and plots visual star signals on the chart, making it easy for traders to spot potential entries.
How the Peak N Valley Indicator Works
- Reversal Detection: The indicator identifies peaks (highs) and valleys (lows) where the market may reverse
- Visual Signals:
- Red Star: Bullish signal – suggests a buy entry
- Blue Star: Bearish signal – suggests a sell entry
- Signal Timing: Signals appear after the reversal has been confirmed, so the entry is slightly shifted on past bars
This system simplifies trading for beginners while providing advanced traders the option to confirm entries using other indicators or Price Action strategies.
How to Trade with Peak N Valley Indicator
- Buy Trade: Enter when a red star appears below the price
- Place a stop loss below the previous swing low
- Book profits at an opposite signal or according to a preferred risk-reward ratio
- Sell Trade: Enter when a blue star appears above the price
- Place a stop loss above the previous swing high
- Book profits at the opposite signal or per your trading plan
- Confirmation: Advanced traders can combine signals with trend indicators, support/resistance, or candlestick patterns
Key Features
- Detects high-probability reversal points on all MT4 timeframes
- Simple star-based visual signals for easy interpretation
- Works for Scalping, intraday, and swing trading
- Suitable for beginners and advanced traders
- Signals can be used with other indicators for higher accuracy
Conclusion
The Peak N Valley indicator for MT4 provides clear buy and sell signals at potential market reversal points. Its simplicity and visual clarity make it an essential tool for traders looking to catch profitable trend reversals.
FAQ
Red stars under price flag bullish valley reversals while blue stars above flag bearish peak reversals—note the colour naming differs from some arrow tools, so verify legend before trading.
The guide admits confirmation lag: pivots validate after the fact, shifting the visual one or more bars—normal for swing detection.
Beyond the swing that invalidates the star scenario, targeting profits on opposing star or planned reward-to-risk.
Layer trend meters or support and resistance because stars still print inside chop.
Attachment timeframe decides the story—fast charts yield quicker star signals suited to scalps and intraday swings, while higher charts space signals for longer holds; match chart speed to the patience you actually trade with.
17 Downloads
Published:
Mar 25, 2026 12:41 PM
Category:
Share: