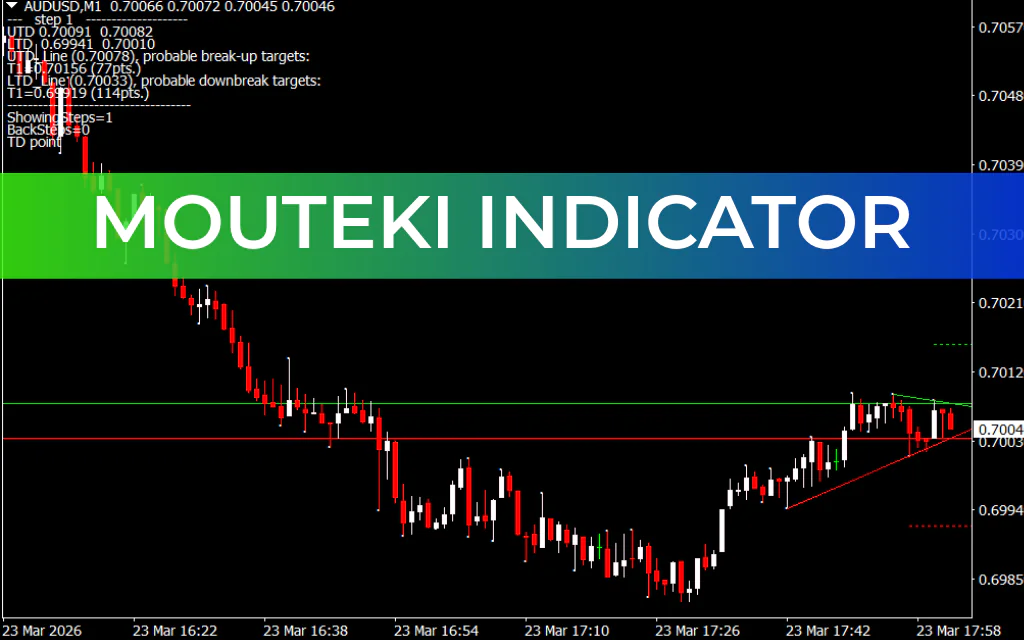
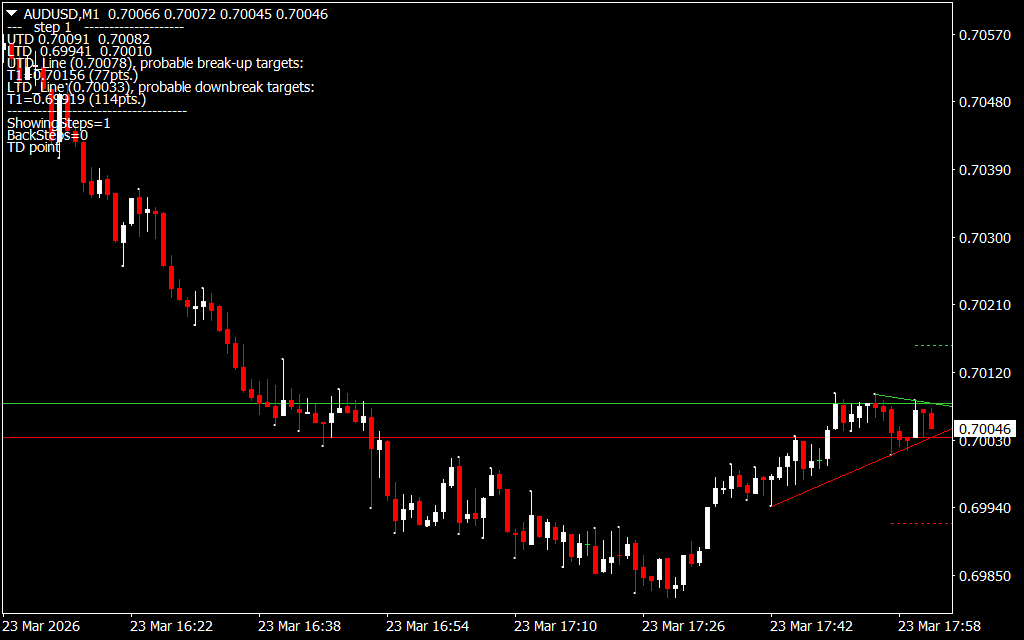
The Mouteki indicator for MetaTrader 4 (MT4) is a powerful technical trading tool designed to help traders identify trend lines and support/resistance zones using historical Price Action. By connecting past highs and lows, the indicator plots accurate trend lines, while horizontal zones mark key areas where the price previously reversed.
This makes the Mouteki indicator ideal for a wide range of traders:
- Trend continuation traders can spot bounce opportunities along the trend line or support zones.
- Breakout traders can identify potential entry points when price breaks through key trend lines or resistance levels.
- Scalpers and intraday forex traders can use the indicator to improve trade timing and optimize entry/exit points.
How to Trade With the Mouteki Indicator on MT4
For example, on the EURUSD pair, the Mouteki indicator plots:
- A diagonal trend line (red) connecting past highs and lows.
- Support And Resistance zones (green and red horizontal lines) where price previously reversed.
Trend continuation strategy: Buy when price bounces off the trend line or support zone.
Breakout strategy: Sell when price breaks the trend line to the downside and gets rejected at a resistance zone on retest.
Key Advantages of the Mouteki Indicator
- Enhances decision-making for trend continuation and breakout setups.
- Works effectively for Scalping and intraday strategies.
- Helps traders identify more precise entry and exit zones.
- Free to download and easy to integrate with MT4.
Conclusion
The Mouteki indicator for MT4 is a must-have for traders seeking a clear visual representation of trend lines and support/resistance zones. For best results, combine it with other technical indicators to improve trading efficiency.
FAQ
Published:
Mar 23, 2026 13:05 PM
Category: