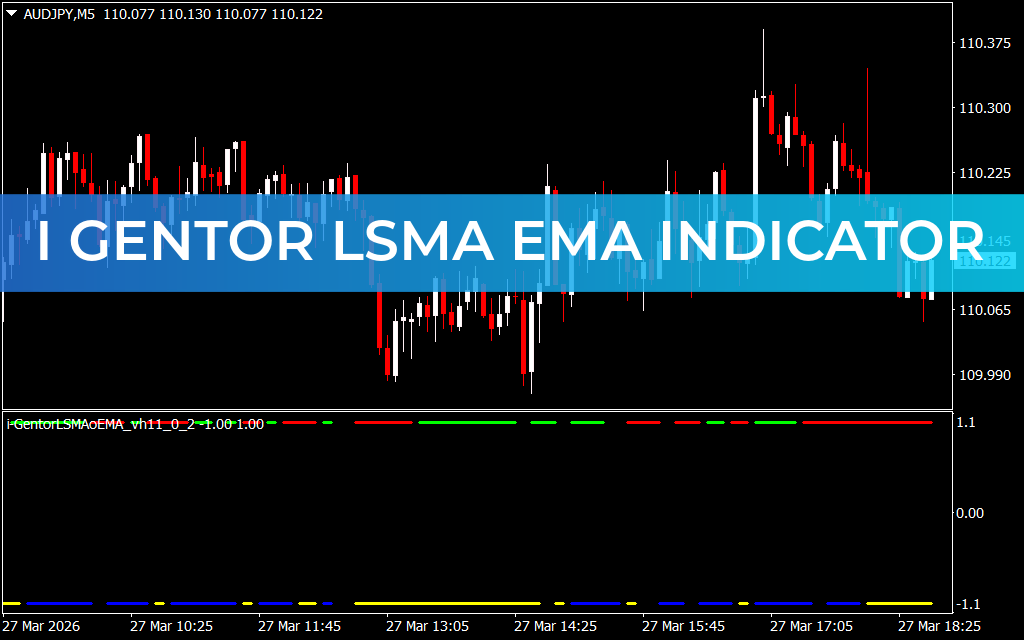
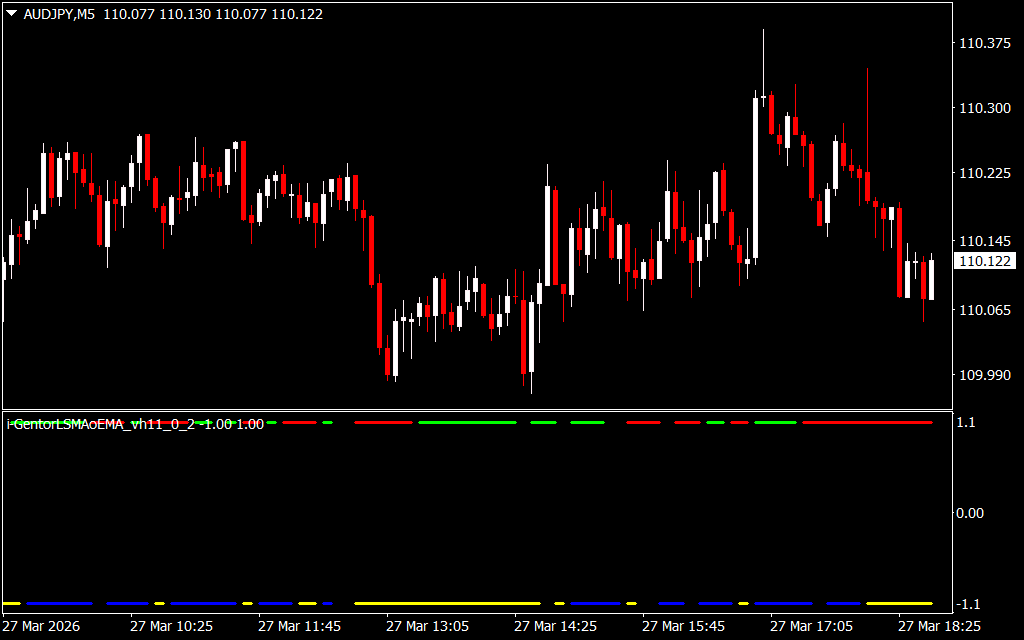
The I Gentor LSMA EMA Indicator for MT4 is a precise moving average-based tool that helps forex traders identify trend direction and generate trading signals. By combining the fast LSMA (Linear Squares Moving Average) and the slow EMA (Exponential Moving Average), the indicator provides clear confirmation when the trend of both averages aligns. This makes it ideal for short-term and Scalping strategies.
Key Features
- Dual moving averages: Fast LSMA and slow EMA for accurate trend detection
- Trend confluence signals: Enter trades only when both averages align
- Clear visual cues:
- LSMA: Green = bullish, Red = bearish
- EMA: Blue = bullish, Yellow = bearish
- All intraday charts: Works best up to H1 timeframe
- Beginner-friendly: Easy to read and implement
How the Indicator Works
The indicator separates the two moving averages for clarity:
- Upper section – LSMA: Fast-moving and reactive to price changes
- Lower section – EMA: Smoother Trend Confirmation
When both LSMA and EMA point in the same direction, traders receive a strong signal to enter the market.
I Gentor LSMA EMA Trading Strategy
Buy Setup (Bullish Trend)
- Both LSMA and EMA indicate bullish trend
- Enter a buy trade
- Place stop loss below the previous swing low
- Book profits when either moving average signals a Trend Reversal
Sell Setup (Bearish Trend)
- Both LSMA and EMA indicate bearish trend
- Enter a sell trade
- Place stop loss above the previous swing high
- Exit when one of the indicators signals a bullish trend
The fast LSMA reacts quickly to price changes, making this indicator particularly effective for scalping lower timeframe charts.
Conclusion
The I Gentor LSMA EMA Indicator for MT4 is a must-have tool for moving average-based traders. By combining LSMA and EMA signals, it simplifies trend identification, improves trade timing, and enhances scalping and short-term trading strategies.
FAQ
1 Download
Published:
Mar 27, 2026 13:51 PM
Category: