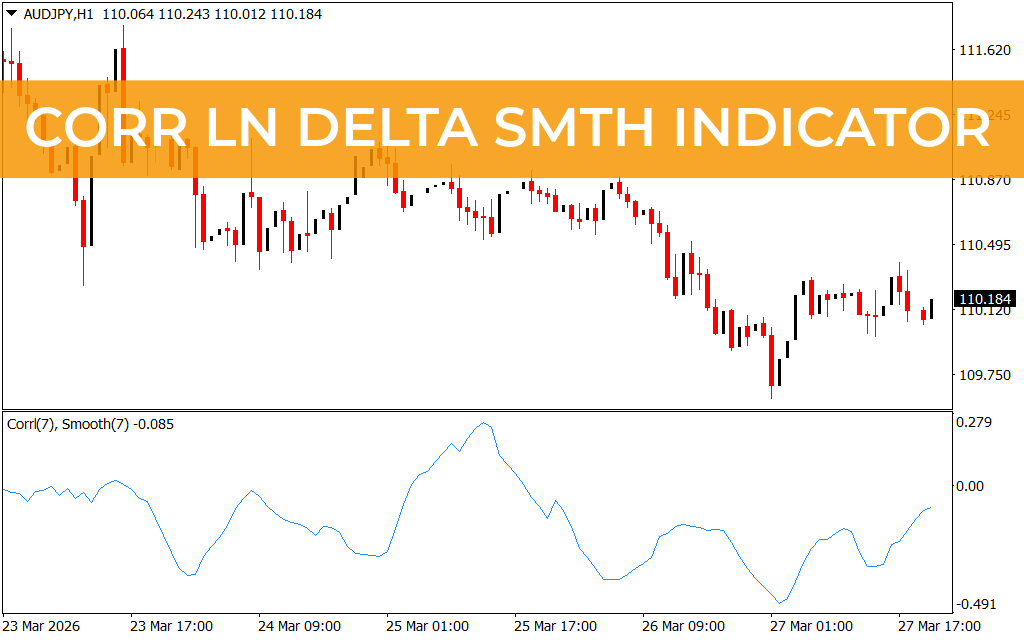
The Corr Ln Delta Smth Indicator for MT4 is a specialized trading tool that measures the correlation between two assets. By calculating the difference between the logarithmic values of their closing prices, this indicator helps traders detect divergences and generate profitable buy and sell signals in both forex and stock markets.
Key Features of Corr Ln Delta Smth Indicator
- Divergence Detection: Identifies regular and hidden divergences between the indicator and Price Action.
- Correlation Analysis: Measures the strength and relationship between two assets for better trading decisions.
- Multi-Asset Use: Suitable for forex, stocks, and other financial instruments.
- MT4 Compatibility: Works seamlessly on all MT4 timeframes.
How to Trade with Corr Ln Delta Smth
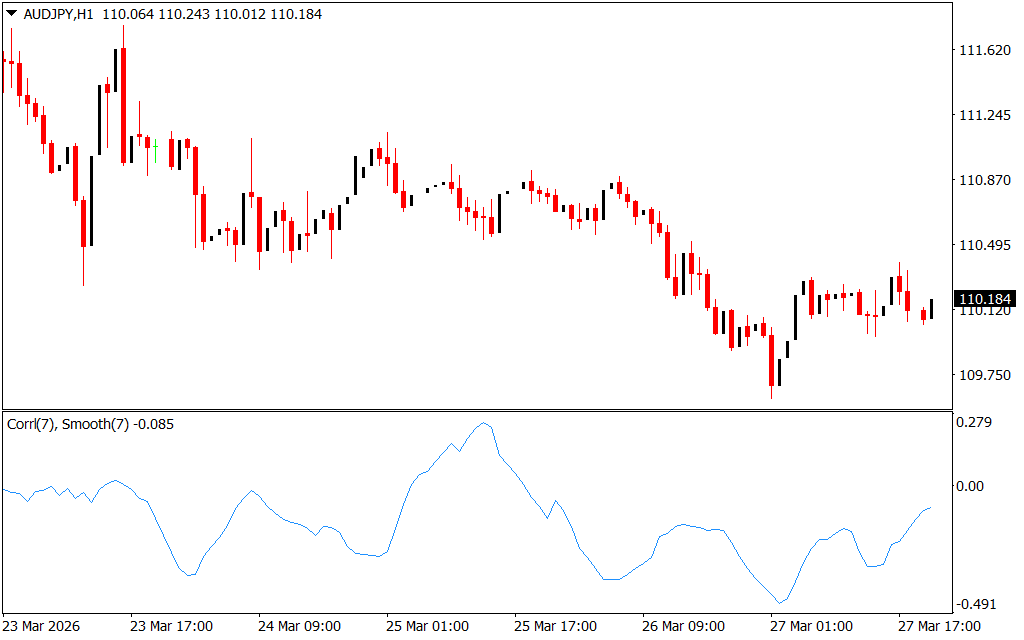
Traders use the indicator primarily to spot divergences:
- Bearish Divergence: Occurs when the price makes a higher high but the indicator forms a lower high. Consider a sell trade after confirming the trend with a secondary indicator.
- Bullish Divergence: Occurs when the price makes a lower low but the indicator forms a higher low. Confirm the trend before entering a buy trade.
- Confirmation: Using support/resistance or trendline levels increases the probability of successful trades.
By focusing on divergences and asset correlation, the Corr Ln Delta Smth Indicator helps traders reduce false signals and align trades with the dominant market trend.
Why Traders Use Corr Ln Delta Smth
The Corr Ln Delta Smth Indicator is ideal for traders looking to enhance divergence-based trading strategies. It provides objective, data-driven signals that can improve trade accuracy when combined with other technical tools and risk management strategies.
Conclusion
In summary, the Corr Ln Delta Smth Indicator for MT4 is a robust tool for measuring asset correlations and detecting divergences. Used in conjunction with trend analysis and technical indicators, it helps traders make informed, profitable trading decisions.
FAQ
Published:
Mar 27, 2026 19:36 PM
Category: