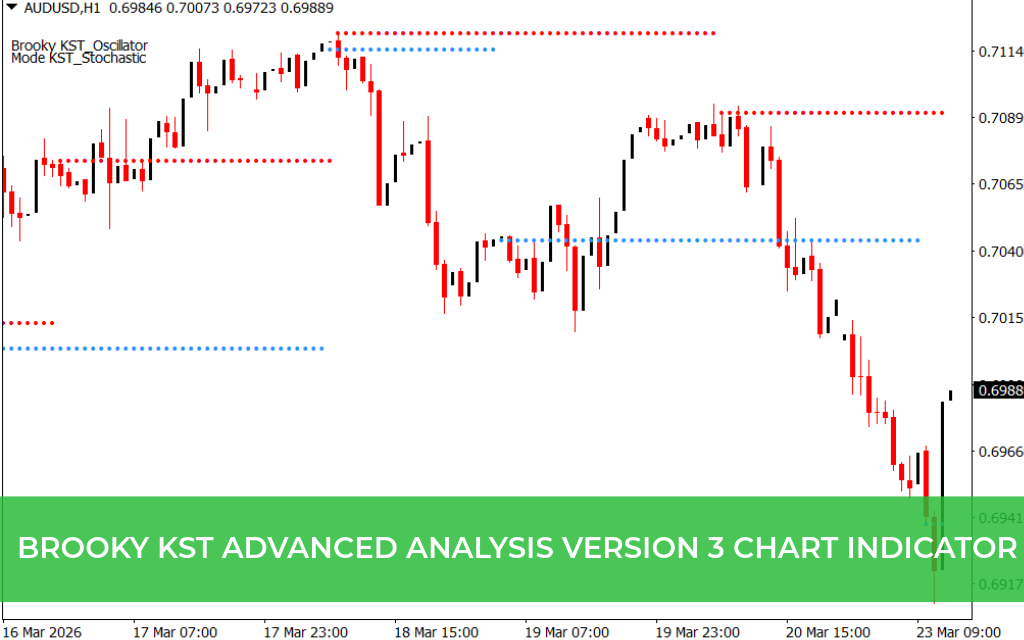
The Brooky KST Advanced Analysis Version 3 Chart Indicator is a powerful MetaTrader tool designed to help traders identify Supply And Demand zones on their charts. These highlighted zones often act as potential Support And Resistance levels, making it easier to spot high-probability trading opportunities.
Built using the KST, Stochastic, and Relative Strength Index (RSI), this indicator also comes with a signal alert system, notifying traders when a potential trade setup occurs. For even better efficiency, it can be used in combination with its previous versions.
How to Trade Using Brooky KST Advanced Analysis Version 3
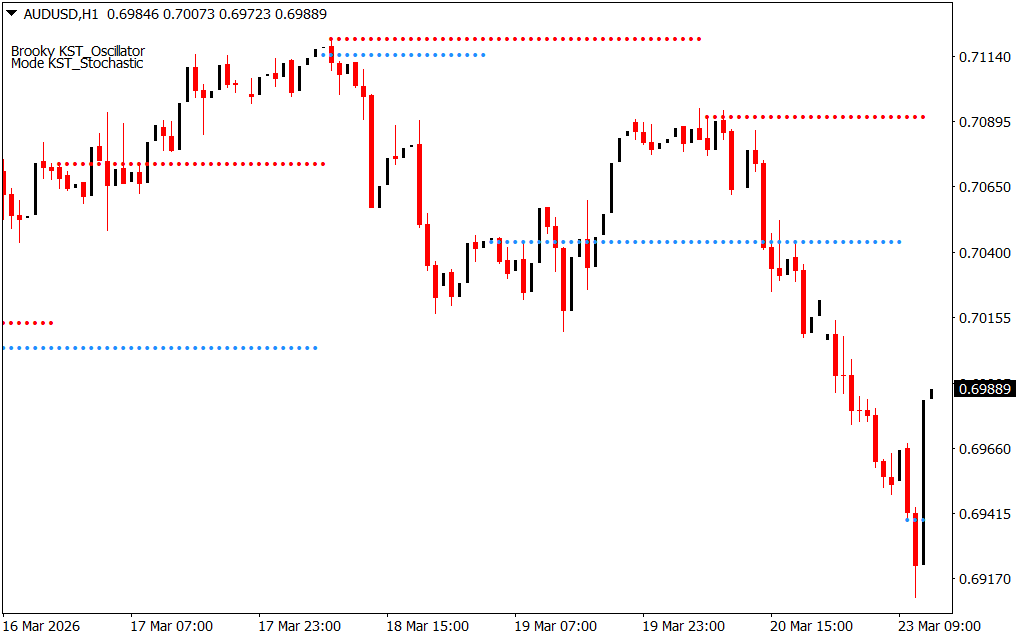
The indicator automatically plots supply and demand zones on your chart. Here’s an example of a trading approach:
- On an H1 EUR/USD chart, the indicator may identify resistance and support zones.
- If the market is trending downward, focus on shorting at resistance zones rather than buying at support.
- A sell entry may be confirmed by a bearish candlestick pattern, such as a bearish Engulfing Pattern, at a highlighted resistance zone.
This method allows traders to trade with the trend while leveraging the zones identified by the indicator for precise entries and exits.
Advantages of the Brooky KST Advanced Analysis V3 Indicator
- Automatically identifies supply and demand zones
- Highlights potential support and resistance levels
- Provides alert notifications for trade opportunities
- Combines multiple indicators for stronger trend and momentum analysis
- Compatible with MT4 and MT5 platforms
- Suitable for novice and advanced traders
Conclusion
The Brooky KST Advanced Analysis Version 3 Chart Indicator is an essential tool for traders looking to identify high-probability support and resistance zones. By signaling potential trading opportunities and confirming trend directions, it simplifies trade analysis and enhances decision-making. Download the indicator for free and integrate it into your trading strategy today.
FAQ
4 Downloads
Published:
Mar 23, 2026 08:33 AM
Category: