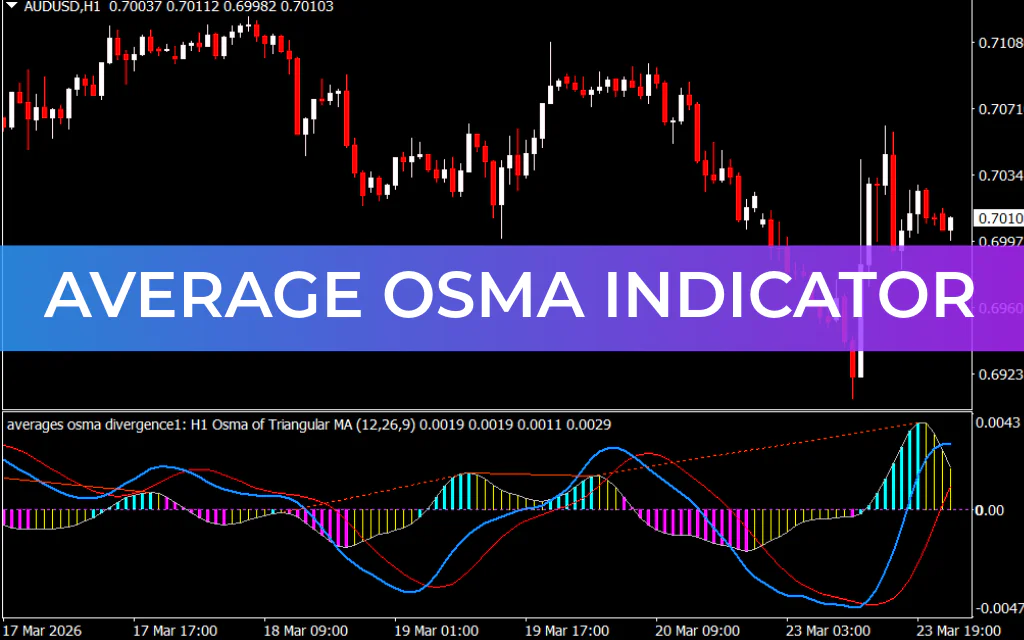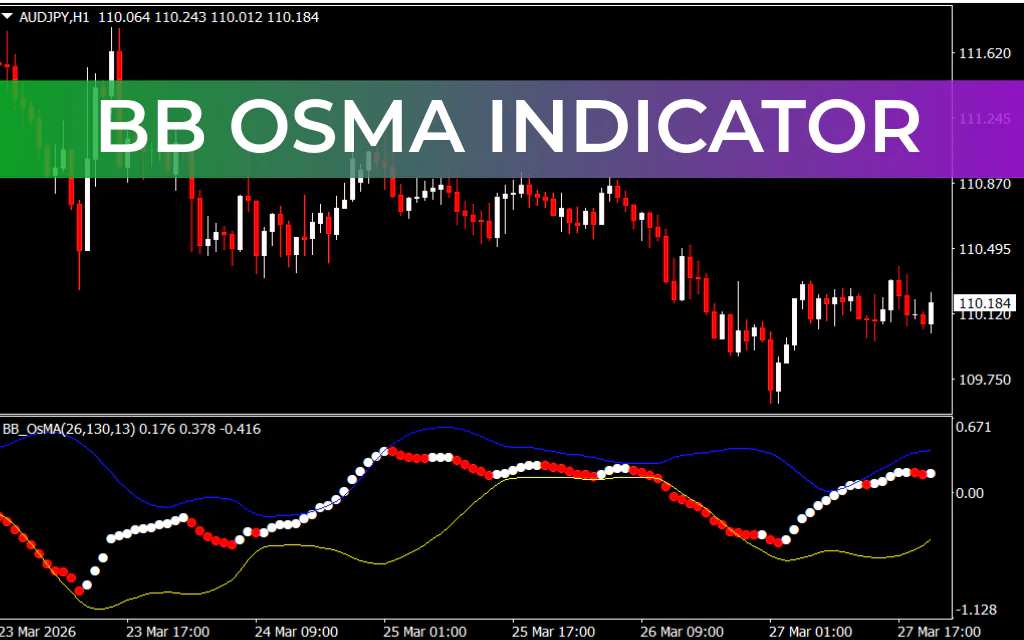
The BB OSMA Indicator for MT4 is a powerful technical analysis tool designed to help traders identify market trends, momentum shifts, and potential buy/sell signals. Popular among day and intraday traders, it emphasizes recent price changes to provide accurate, real-time trading insights.
Key Features of BB OSMA Indicator
- Momentum Tracking: Based on MACD principles, it measures the difference between 12-EMA and 26-EMA.
- Histogram Signals: Positive histogram bars indicate bullish momentum, while negative bars indicate bearish momentum.
- Flexible Application: Works well for trend identification, divergence analysis, and trade signal filtering.
- Real-Time Alerts: Offers immediate visual cues for intraday and day trading setups.
How to Trade with BB OSMA Indicator
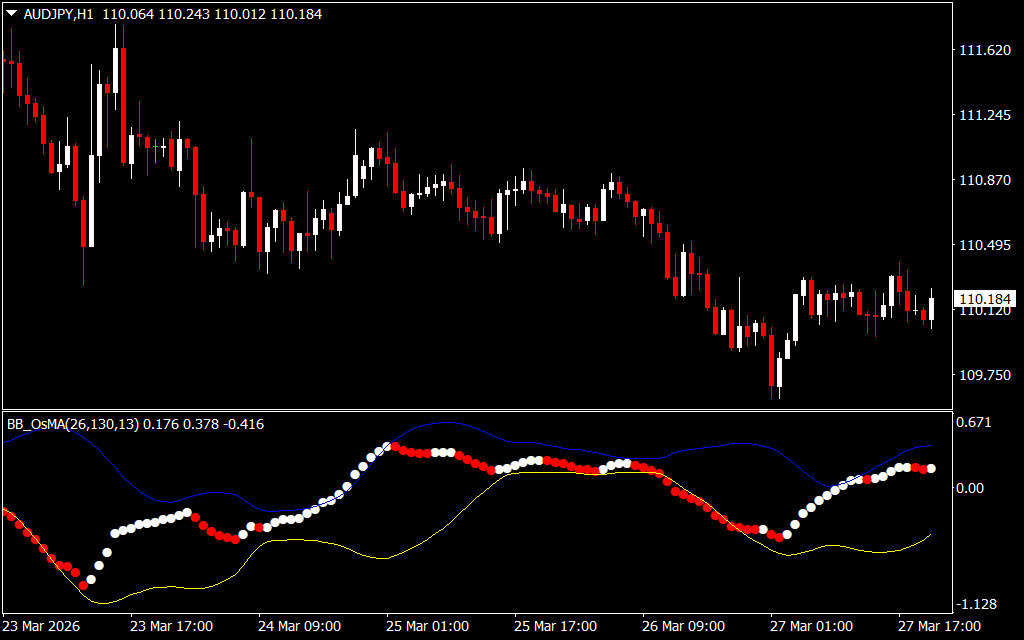
Trading decisions are based on the histogram and its color changes:
- Buy Signal: Enter a long trade when the histogram rebounds from the lower band and the dotted line turns white, confirming bullish momentum.
- Sell Signal: Enter a short trade when the histogram drops from the upper band and the level turns red, indicating bearish momentum.
- Trade Confirmation: Combine with price patterns such as triangles, support/resistance, or breakouts for higher accuracy.
By focusing on recent Price Action and momentum changes, the BB OSMA Indicator helps traders reduce false signals and stay aligned with market trends.
Why Traders Use BB OSMA
The BB OSMA Indicator is ideal for traders who want a reliable momentum and trend tool. It seamlessly integrates with other technical indicators and trading strategies, making it a versatile addition to any MT4 toolbox.
Conclusion
In summary, the BB OSMA Indicator for MT4 is an essential tool for identifying bullish and bearish trends, spotting divergence, and generating precise buy/sell signals. Its real-time responsiveness makes it particularly effective for intraday trading.
FAQ
2 Downloads
Published:
Mar 27, 2026 19:34 PM
Category: