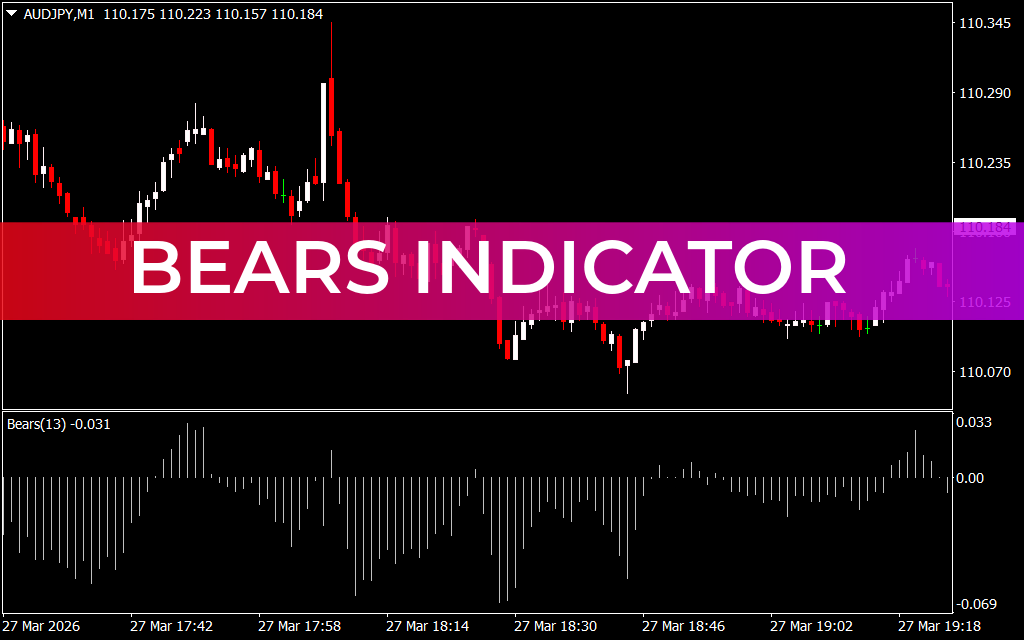
The Bears Indicator for MT4 is a powerful trend oscillator developed by Alexander Elder to measure the strength of sellers (bears) in the financial markets. It helps traders understand whether bearish momentum is increasing or weakening, allowing for better timing of trade entries and exits.
Unlike traditional indicators that generate direct buy or sell signals, the Bears Indicator focuses on analyzing market pressure from sellers, making it an excellent confirmation tool in technical analysis.
How the Bears Indicator Works
The Bears Indicator calculates seller strength by measuring the difference between:
- The 13-period Exponential Moving Average (EMA)
- The lowest price of each bar (candle)
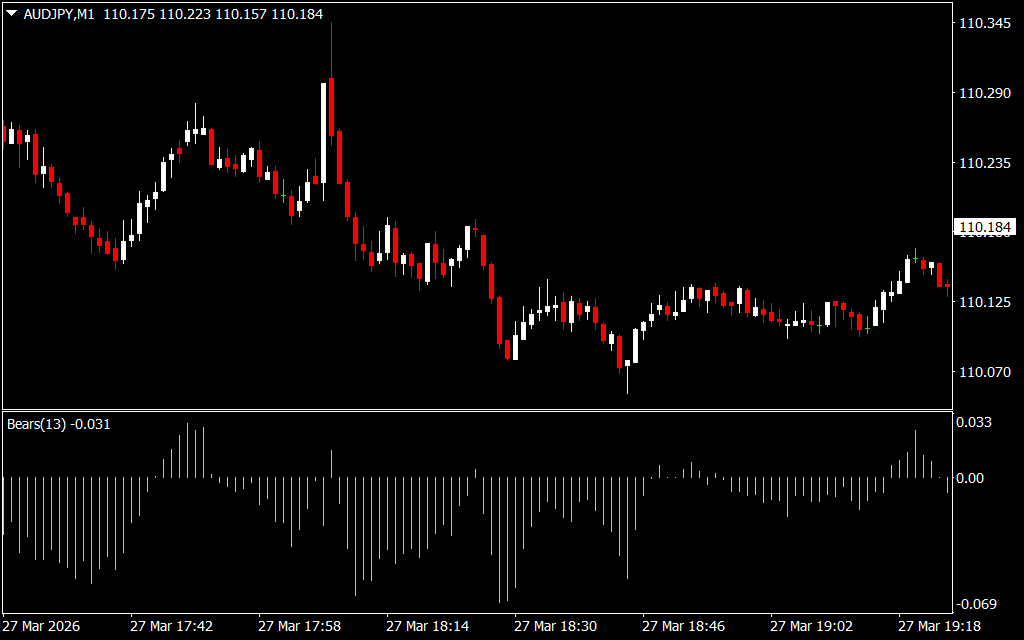
This difference is displayed as a histogram, making it easy to interpret market sentiment.
- Below Zero Line: Indicates increasing bearish pressure (stronger sellers)
- Above Zero Line: Suggests weakening bearish momentum
When histogram bars move further below zero, it shows that sellers are gaining control of the market.
How to Trade with the Bears Indicator
The Bears Indicator is best used as a supporting tool rather than a standalone signal generator. It helps traders confirm trends and refine their strategies.
Identifying Selling Opportunities
- Look for histogram bars moving below the zero line
- This indicates strong bearish momentum
- Consider entering sell trades in alignment with the trend
Exit Signals and Reversal Clues
- Watch for divergence between price and the indicator
- If price continues downward but the indicator weakens, a Trend Reversal may be near
- Use this as a signal to exit sell positions or secure profits
Using the Indicator Effectively
To maximize accuracy and reduce false signals, combine the Bears Indicator with other tools such as:
- Trend indicators (e.g., moving averages)
- Support And Resistance levels
- Price Action analysis
This multi-layered approach helps confirm market direction and improves trading confidence.
Conclusion
The Bears Indicator for MT4 is a valuable tool for analyzing seller dominance and market momentum. Suitable for both beginner and advanced traders, it enhances decision-making by highlighting bearish strength and potential reversals. Best of all, it is free to download and easy to integrate into any trading strategy.
FAQ
Published:
Mar 28, 2026 18:39 PM
Category: