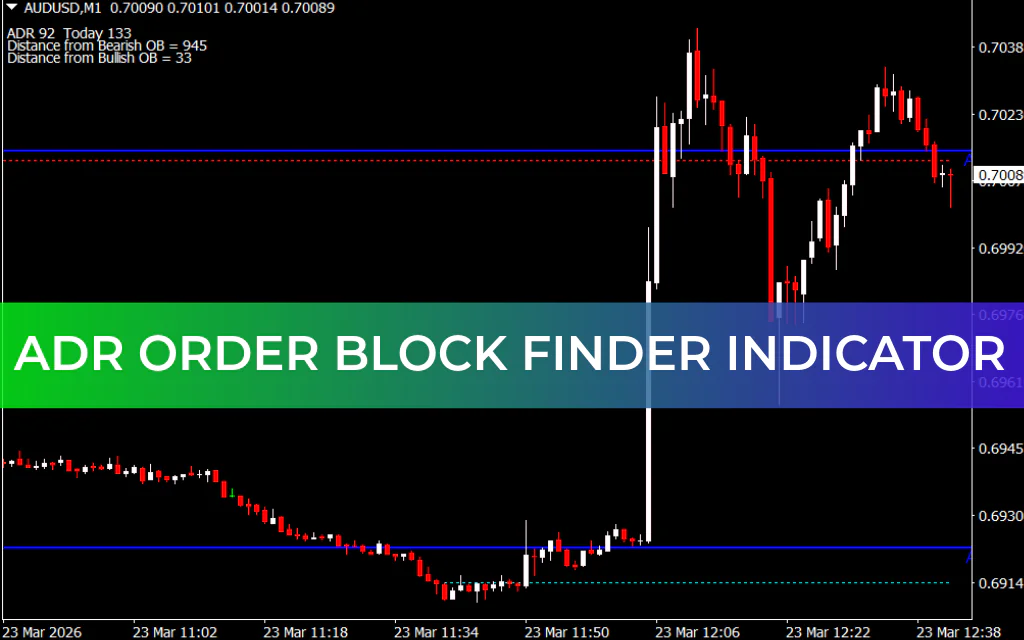
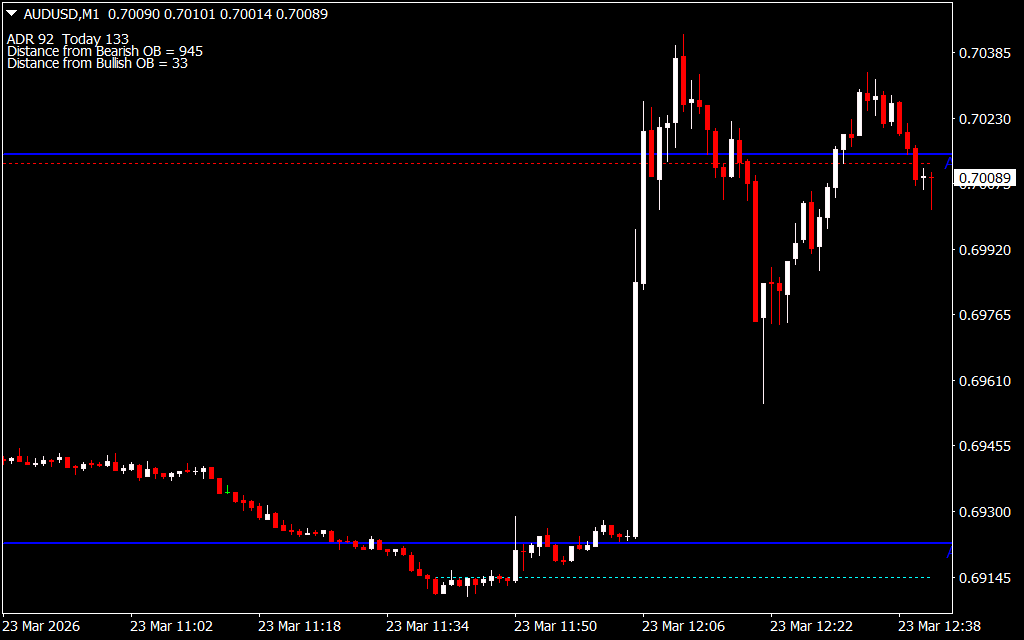
The ADR Order Block Finder Indicator for MT4 is a practical tool for analyzing price activity shifts in the forex market. Based on the Average Daily Range (ADR) concept, this indicator helps traders measure the distance between bullish and bearish movements and anticipate short-term market trends.
Unlike traditional ADR indicators that only compare previous and current day price ranges, this indicator focuses on advance and decline order ratios, providing insights into market momentum.
What Is the ADR Order Block Finder Indicator?
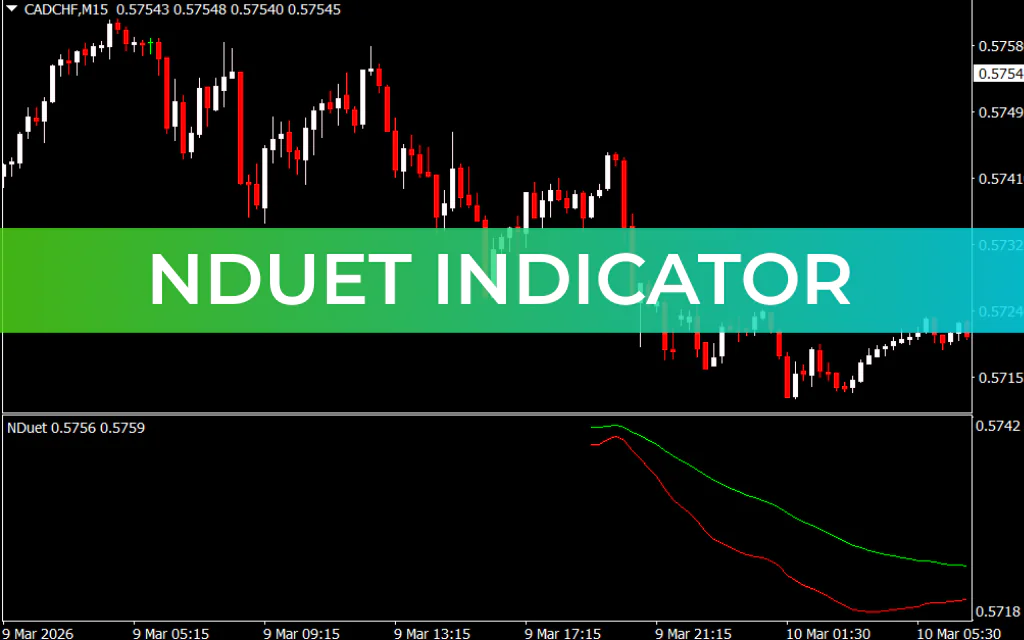
The ADR Order Block Finder Indicator calculates the average difference between the high and low prices over a specified period. It visually plots two lines on your chart:
- Blue line – Represents bullish movement
- Red line – Represents bearish movement
These lines show the relative strength of buying and selling activity, helping traders detect potential trend shifts.
Best Timeframes
The indicator works most effectively on shorter timeframes, such as:
- 30-minute charts (M30)
- 1-hour charts (H1)
Traders can adjust settings to match their preferred trading style.
How to Interpret ADR Order Block Finder
While the indicator doesn’t directly provide BUY or SELL signals, it highlights trend direction:
- Bullish dominance: Blue line values are higher → Uptrend → Consider entering long positions
- Bearish dominance: Red line values are higher → Downtrend → Consider entering short positions
For precise trade entries, combine this indicator with other tools like RSI, MACD, or support/resistance levels.
How to Use for Trading
- Observe the distance between bullish and bearish lines
- Identify the ADR START – the point where price activity begins for the day
- Confirm trend direction using additional indicators
- Enter BUY trades when bullish lines dominate and SELL trades when bearish lines dominate
This approach ensures better timing and alignment with the market’s short-term momentum.
Advantages of the ADR Order Block Finder Indicator
- Simple and easy to interpret
- Shows average daily price range shifts
- Highlights Trend Strength and direction
- Works on shorter intraday timeframes
- Can be combined with other technical indicators for accuracy
Limitations
- Does not provide direct entry signals
- Requires additional confirmation tools for precise trade execution
- Best suited for intraday trading rather than long-term analysis
Conclusion
The ADR Order Block Finder Indicator is a valuable MT4 tool for traders who want to monitor intraday bullish and bearish trends. By calculating the average distance between high and low prices and comparing day-to-day activity, it gives insights into potential market movements.
For best results, use it alongside other indicators like RSI or MACD, and practice on a demo account before risking real funds. You can download the indicator for free and integrate it into your MT4 trading setup today.
FAQ
2 Downloads
Published:
Mar 23, 2026 07:44 AM
Category: