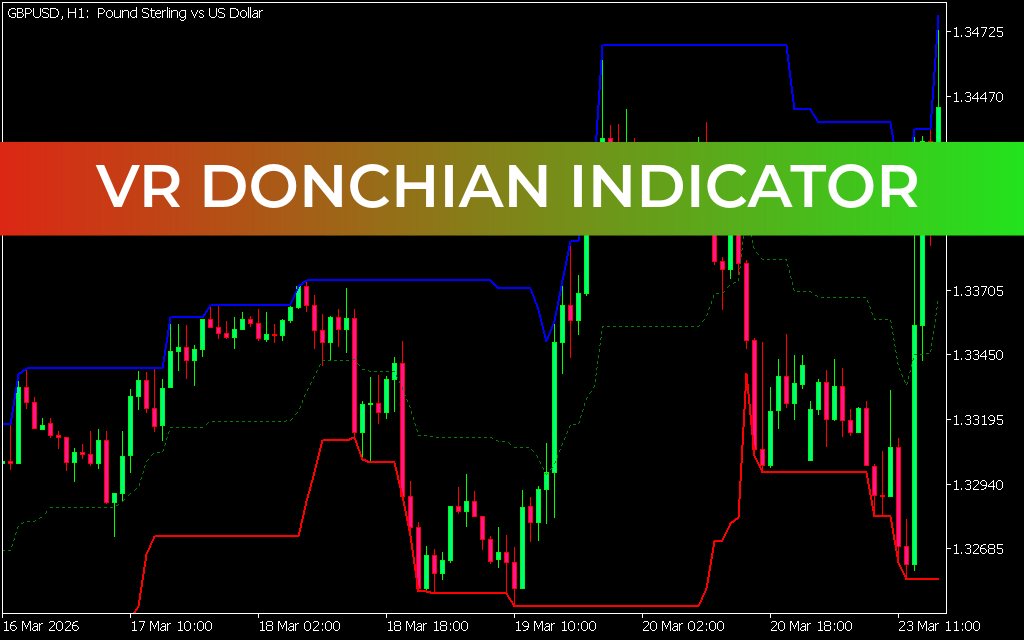
The VR Donchian Indicator for MT5 is a trend-following technical analysis tool designed to help traders identify market direction using dynamic price bands. It is based on the classic Donchian Channel concept but enhances visualization by displaying structured bands that reflect current price movement.
Built for the MetaTrader 5 trading platform, this indicator is widely used for breakout trading, trend identification, and support-resistance analysis across all financial markets.
What Is the VR Donchian Indicator?
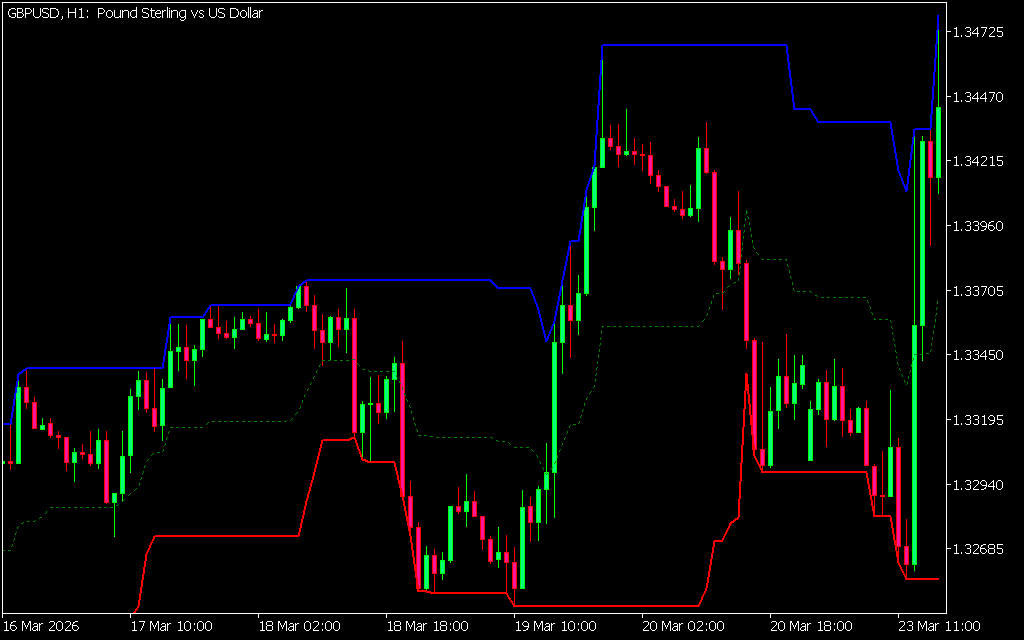
The VR Donchian Indicator plots three price bands on the chart that represent market extremes and equilibrium levels:
- Upper band: Potential resistance zone
- Lower band: Potential support zone
- Middle band: Neutral market zone
Price typically moves between these bands, helping traders identify potential entry and exit points.
Key Features
- Dynamic 3-band structure (upper, middle, lower)
- Based on Donchian channel logic
- Works on all timeframes (best on higher timeframes)
- Acts as both trend and Breakout Indicator
- Helps define support and resistance levels
How the VR Donchian Indicator Works
The indicator tracks price movement within a defined range:
- 📉 Price near lower band → potential buy zone
- 📈 Price near upper band → potential sell zone
- ⚪ Middle band → neutral area (avoid trading decisions)
The bands automatically adjust based on market volatility and recent price highs and lows.
How to Trade Using VR Donchian Indicator
📈 Buy Setup (Lower Band Touch)
- Price touches or breaks the lower band
- Market shows support reaction
- Enter a buy trade after confirmation
- Use middle band or recent low as reference for stop loss
📉 Sell Setup (Upper Band Touch)
- Price reaches the upper band
- Market shows rejection or reversal signal
- Enter a sell trade after confirmation
- Use middle band or recent high for stop loss
Neutral Zone Strategy
- When price is near the middle band, market is uncertain
- Avoid trading during this phase
- Wait for clear breakout toward upper or lower band
Why Traders Use VR Donchian Indicator
- Clearly defines breakout zones
- Works as dynamic support and resistance tool
- Helps filter market noise
- Suitable for trend-following and range trading strategies
Best Practices
To improve accuracy:
- Use on higher timeframes (H1, H4, Daily)
- Combine with trend indicators (moving averages, TSI, etc.)
- Confirm signals with Price Action patterns
- Avoid trading during sideways consolidation near the middle band
Conclusion
The VR Donchian Indicator for MT5 is a powerful trend and breakout tool that helps traders identify support, resistance, and market direction using dynamic price bands. By analyzing price interaction with upper and lower channels, traders can make more informed entry and exit decisions. When combined with confirmation tools, it becomes an effective part of any trading strategy.
Published:
Apr 10, 2026 11:45 AM
Category: