he VH Indicator for MT4 is a powerful trend-following trading tool designed to help Forex traders easily identify bullish and bearish market trends. It uses a combination of technical indicators to generate reliable trading signals and displays them directly on the chart as continuous colored dots.
By visually highlighting the market trend, the indicator allows traders to quickly understand market direction without performing complex technical analysis. This makes it suitable for both beginner and advanced Forex traders who want a simple yet effective trend identification tool.
New traders can instantly recognize whether the market is bullish or bearish by looking at the color of the dots, while experienced traders can integrate the indicator into advanced trading systems or combine it with other technical indicators for stronger confirmation signals.
How the VH Indicator Works
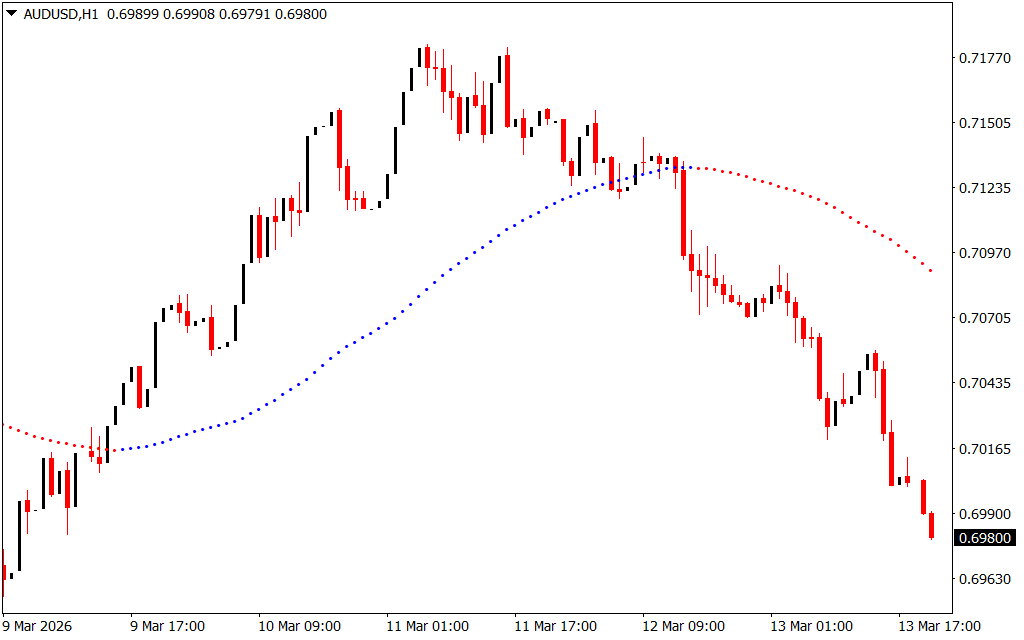
The VH Indicator identifies trends and displays them directly on the price chart using colored dots:
- Blue dots represent a bullish trend.
- Red dots represent a bearish trend.
These visual signals allow traders to quickly determine the current market direction and plan trades accordingly.
When the indicator changes color, it usually signals the beginning of a new trend, helping traders enter positions early in the movement.
VH Indicator for MT4 Trading Signals
Buy Signal (Bullish Trend)
A BUY signal occurs when the indicator changes color to blue.
Trading steps:
- Wait for the indicator dots to switch from red to blue.
- Enter a BUY trade at the start of the bullish trend.
- Place the stop loss below the previous swing low.
- Set the take profit at the next opposite signal or key resistance level.
Sell Signal (Bearish Trend)
A SELL signal appears when the indicator changes color to red.
Trading steps:
- Wait for the indicator dots to change from blue to red.
- Enter a SELL trade at the start of the bearish trend.
- Place the stop loss above the previous swing high.
- Exit the trade when the indicator changes color again.
Traders can also hold positions while the dots maintain the same color, as it indicates that the current trend is still active.
Multi-Timeframe Trading with the VH Indicator
One of the strengths of the VH Indicator is that it works well across all timeframes, including:
- Intraday charts
- Daily charts
- Weekly charts
- Monthly charts
Because higher timeframes typically show more stable trends, traders often use them to determine the primary market direction. Then they switch to lower timeframes to find precise trade entries.
For example:
- Identify the main trend on the daily chart.
- Enter trades on the H1 or M15 chart in the same direction.
This multi-timeframe approach can improve entry accuracy and risk management.
Benefits of the VH Indicator for MT4
Key advantages include:
- Simple visual trend identification
- Clear buy and sell signals
- Works on all timeframes
- Suitable for beginners and professional traders
- Can be combined with oscillators like RSI or MACD
- Lightweight and easy to install
Many traders use the indicator primarily to identify the trend, then confirm entries using momentum oscillators.
Conclusion
The VH Indicator for MT4 is an excellent tool for traders who rely on trend-based strategies. By displaying bullish and bearish trends with easy-to-read colored dots, it simplifies market analysis and helps traders quickly identify trading opportunities.
Whether you are a beginner learning trend trading or an experienced trader building a multi-indicator strategy, the VH Indicator can help you follow market trends more effectively. Best of all, it is free to download and simple to install on the MT4 platform.
FAQ
6 Downloads
Published:
Mar 14, 2026 19:09 PM
Category: