The TSI MACD Indicator for MT4 combines two well-known technical indicators: the True Strength Index and the Moving Average Convergence Divergence. By merging these tools, the indicator filters market noise and smooths price fluctuations, providing clearer bullish and bearish trading signals.
Because it blends momentum and trend analysis, the TSI MACD indicator often produces more reliable BUY and SELL signals compared to using either indicator individually.
This tool is suitable for both beginner and experienced forex traders. New traders can follow its simple crossover signals, while advanced traders can combine it with price action, Support And Resistance levels, and trend analysis for better confirmation.
Additionally, the indicator works on all chart timeframes, including:
- Intraday charts (M15, M30, H1)
- Medium-term charts (H4)
- Long-term charts (Daily, Weekly, Monthly)
It is also free to download and easy to install on the MetaTrader platform.
TSI MACD Indicator Trading Signals
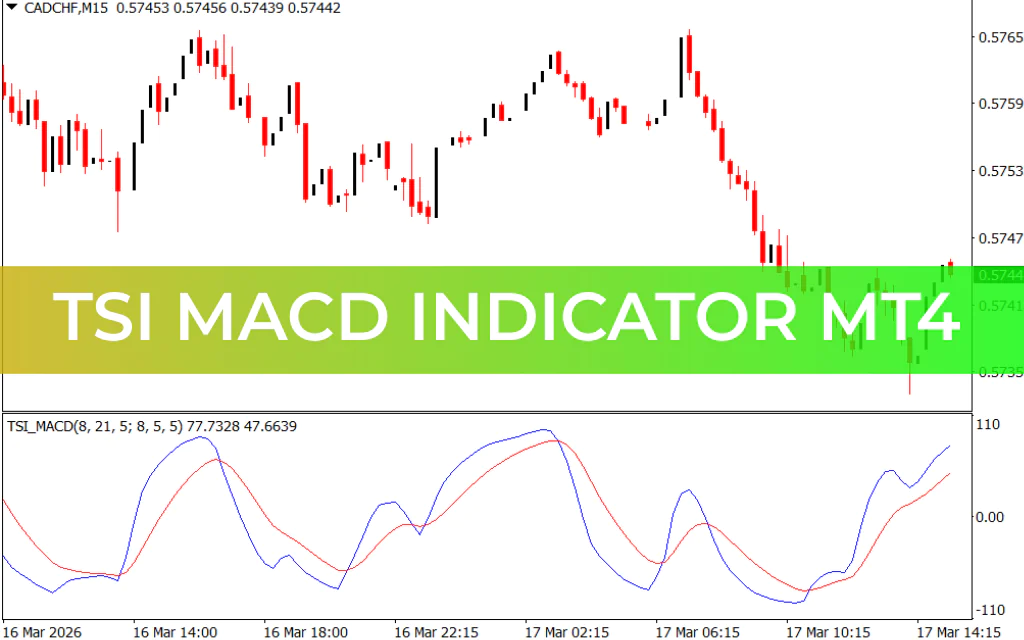
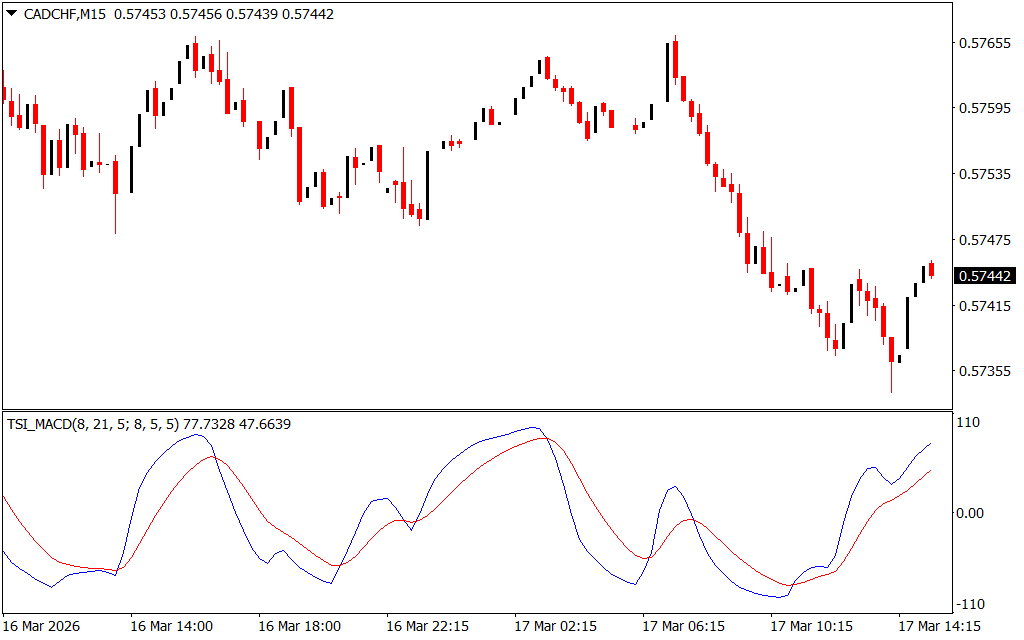
When applied to a chart such as the EUR/USD H4 chart, the indicator displays two lines:
- Blue Line – Represents the primary momentum signal
- Red Line – Represents the signal line
Trading signals are generated when these lines cross each other.
Buy Signal (Bullish Setup)
A buy opportunity occurs when:
- The Blue line crosses above the Red line.
- The crossover indicates the start of a bullish trend.
Trade management:
- Entry: After the bullish crossover
- Stop Loss: Below the previous swing low
- Exit: When the opposite crossover occurs
This signal suggests that bullish momentum is strengthening.
Sell Signal (Bearish Setup)
A sell opportunity appears when:
- The Blue line crosses below the Red line.
- This indicates the beginning of a bearish trend.
Trade management:
- Entry: After the bearish crossover
- Stop Loss: Above the previous swing high
- Exit: At the next opposite crossover
This setup indicates growing bearish momentum in the market.
Zero Line Cross Trading Strategy
Another popular strategy using the TSI MACD indicator focuses on the zero line.
Bullish Zero-Line Signal
- When the Blue line crosses above the zero line, it signals a bullish market condition.
- Traders may enter a BUY trade.
Trade management:
- Stop Loss: Below the previous low
- Take Profit: When the Red line crosses below the zero line
Bearish Zero-Line Signal
- When the Blue line crosses below the zero line, it indicates a bearish trend.
- Traders may open a SELL position.
Trade management:
- Stop Loss: Above the previous high
- Take Profit: When the Red line crosses back above the zero line
Improving Signal Accuracy
Although the indicator provides strong signals, traders should combine it with additional technical tools such as:
- Support and resistance levels
- Trendlines
- Price channels
- Breakout levels
- Candlestick patterns
These elements help confirm signals and reduce the likelihood of false entries.
Conclusion
The TSI MACD Indicator for MT4 enhances the classic Moving Average Convergence Divergence by integrating the smoothing effect of the True Strength Index. This combination reduces market noise and produces clearer trend and momentum signals.
Because traders can easily identify bullish and bearish market conditions, the indicator becomes a reliable tool for trend trading and momentum-based strategies. With its simple crossover signals and flexible usage across timeframes, the TSI MACD is a valuable addition to any trader’s technical analysis toolkit.
FAQ
Published:
Mar 17, 2026 10:22 AM
Category: