The Trend Intensity Index Indicator for MT5 is a powerful technical analysis tool designed to measure market direction and the strength of price trends. It helps traders identify whether the market is trending strongly, weakening, or entering consolidation.
By analyzing trend intensity, traders can make more informed decisions about when to enter, hold, or exit trades.
What is the Trend Intensity Index?
The Trend Intensity Index is a momentum-based indicator that evaluates:
- Market bias (bullish or bearish)
- Strength of the current trend
- Potential overbought and oversold conditions
It is especially useful for trend-following trading strategies, where traders aim to buy in uptrends and sell in downtrends.
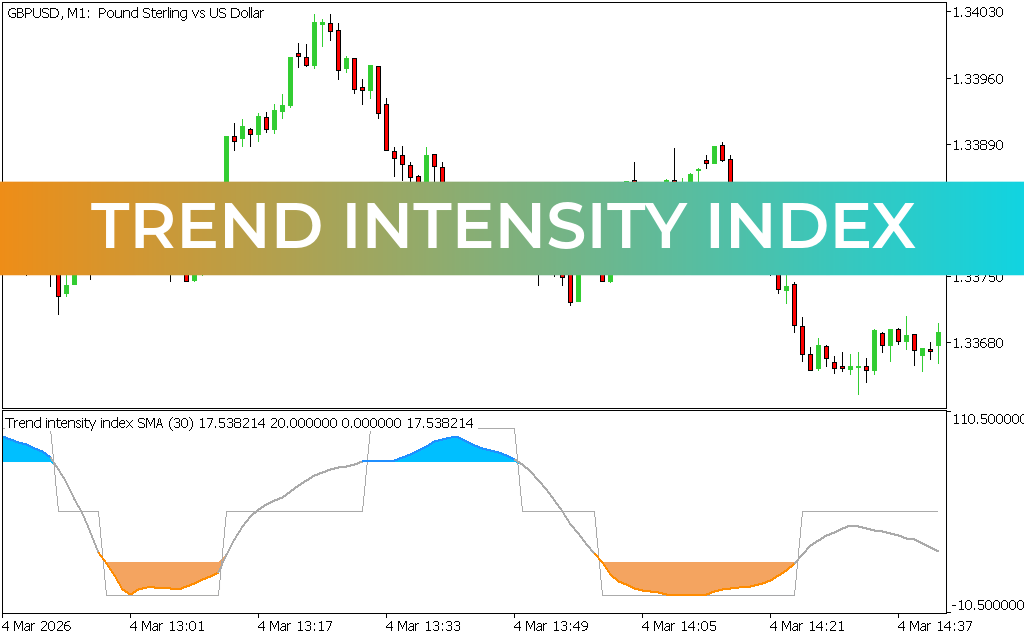
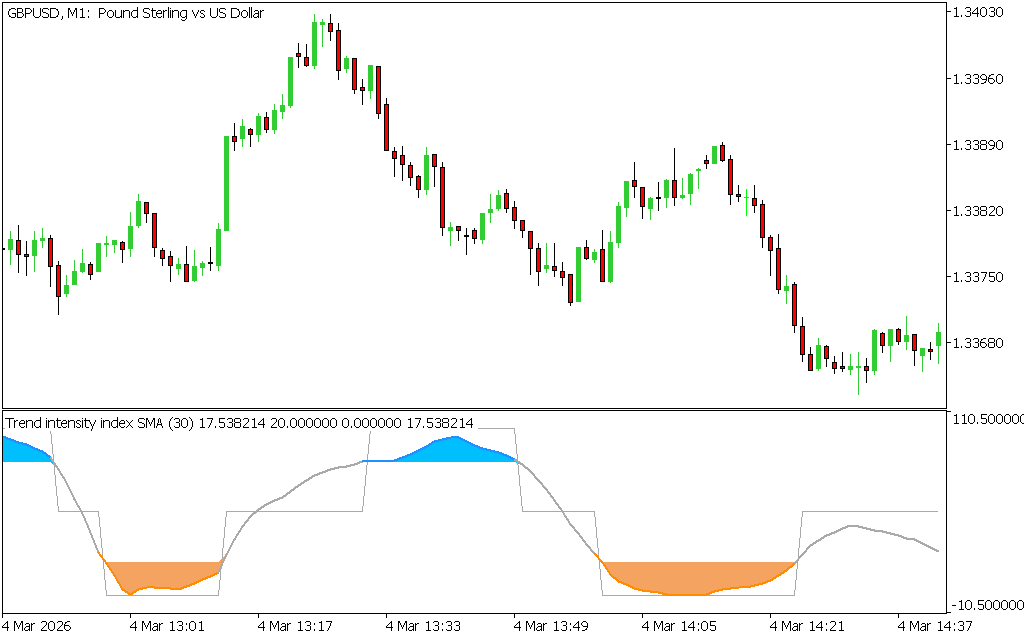
How Does the Trend Intensity Index Work?
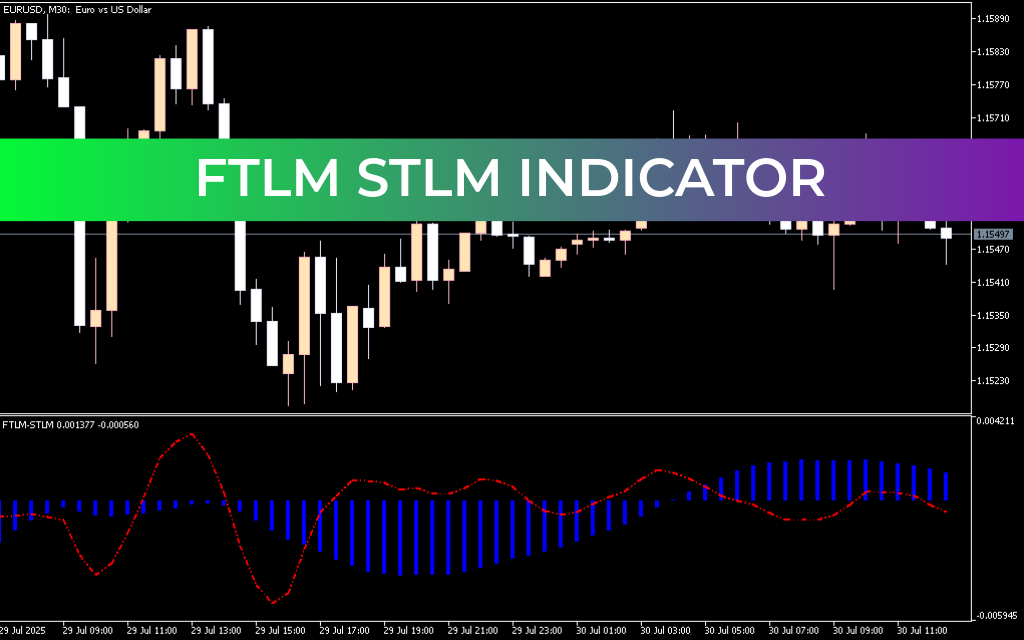
The indicator displays a colored signal line in a separate window, which fluctuates between key levels:
- Below 20 → Oversold zone (potential BUY opportunity)
- Above 80 → Overbought zone (potential SELL opportunity)
- Between levels → Trend development or continuation phase
Signal Colors:
- Brown line → Oversold condition
- Gray line → Trending market (stable momentum)
- Blue line → Overbought condition
These color changes help traders visually interpret market conditions quickly.
How to Trade with the Trend Intensity Index
The Trend Intensity Index can be used to identify entry and exit points in trending markets.
BUY Signal (Long Entry)
A BUY setup occurs when:
- The index drops below 20 (oversold zone)
- The line turns brown and then gray
- Price begins to show bullish momentum
This indicates the start of a potential upward trend.
SELL Signal (Short Entry)
A SELL setup occurs when:
- The index rises above 80 (overbought zone)
- The line changes color (blue → gray transition)
- Momentum begins to weaken
This signals a possible downward reversal.
Trade Management Strategy
The indicator can also help manage trades:
- Enter long positions when the index crosses above 20 and turns gray
- Hold trades while the market remains in a gray trending state
- Exit when the index rises above 80 and signals overbought conditions
This makes it useful for both entry timing and exit planning.
Important Limitations
While powerful, the Trend Intensity Index has limitations:
- It may produce false signals in sideways or choppy markets
- It works best in strong trending conditions
- It should be combined with Price Action or other indicators
Traders should avoid relying on it alone in ranging markets.
Key Benefits of the Trend Intensity Index
- Identifies Trend Strength and direction
- Highlights overbought and oversold zones
- Helps improve trade timing and exits
- Suitable for beginners and advanced traders
- Works with multi-timeframe analysis (MTF trading)
Conclusion
The Trend Intensity Index Indicator for MT5 is a versatile and beginner-friendly tool that helps traders understand market trends and momentum with clarity. By identifying key zones and trend strength, it supports better trading decisions from entry to exit.
However, for best results, it should be used in combination with price action and avoided in choppy market conditions.
Best of all, the Trend Intensity Index Indicator is completely free to download, making it a valuable addition to any trading strategy.
1 Download
Published:
Apr 11, 2026 04:40 AM
Category: