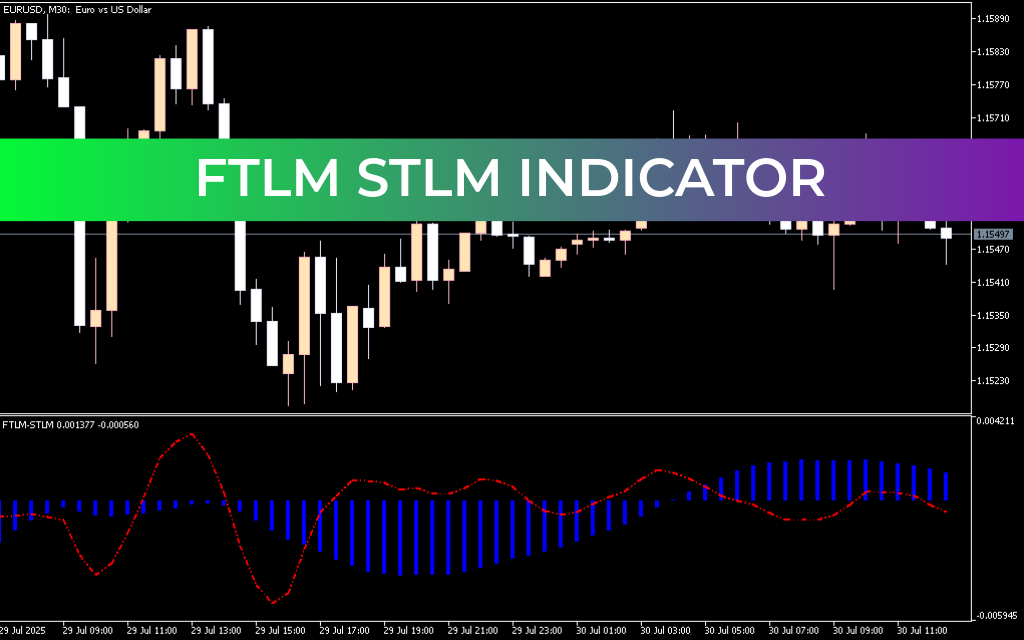
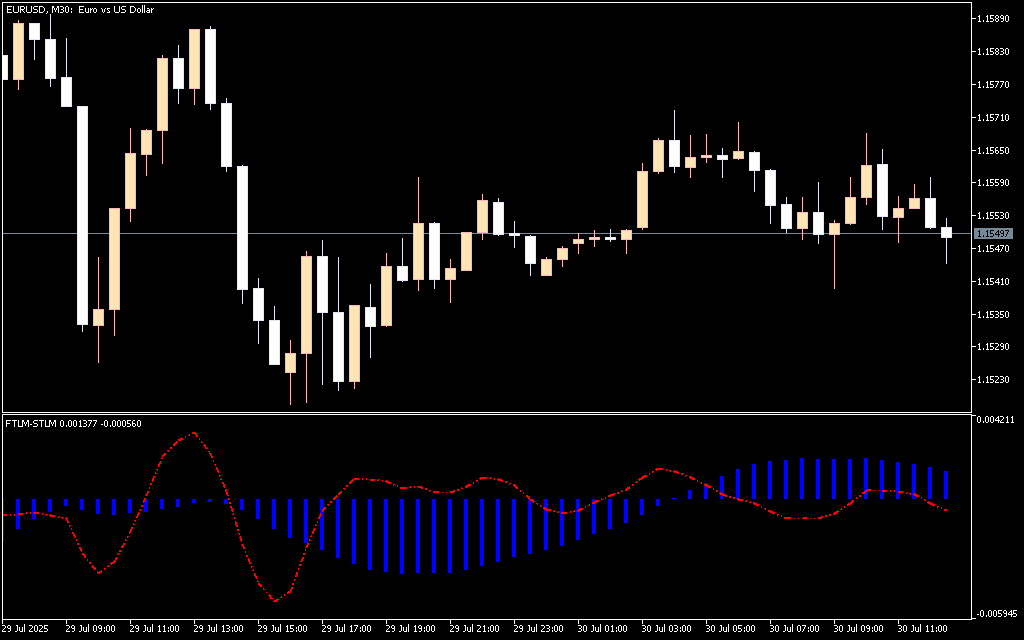
The FTLM STLM Indicator for MetaTrader 5 is a momentum-based oscillator that helps traders gauge Trend Strength, price acceleration, and potential reversals. Its dual-component design—Fast Trend Line Momentum (FTLM) and Slow Trend Line Momentum (STLM)—provides a precise view of shifting market dynamics, making it suitable for trend-following and reversal strategies.
How It Works
1️⃣ Dual Trend Line Momentum
- FTLM (Fast): Tracks quick changes in price momentum
- STLM (Slow): Measures longer-term trend direction
- The interaction between FTLM and STLM signals trend shifts
2️⃣ Signal Generation
- Bullish Signal: FTLM crosses above STLM → potential buying opportunity
- Bearish Signal: FTLM crosses below STLM → potential selling opportunity
- Histogram Bars: Positive (blue) for uptrend, negative (red) for downtrend
- Color shifts act as visual confirmation of trend strength
3️⃣ Applications
- Trend Traders: Identify strong momentum continuation
- Reversal Traders: Spot early trend exhaustion or turning points
- Swing Traders: Combine with support/resistance levels for precision entries
Key Features
- Dual momentum lines for fast and slow trend detection
- Clear histogram and color-coded bars for visual clarity
- Works on multiple timeframes and instruments
- Helps confirm entries, exits, and trend reversals
- Suitable for discretionary and systematic trading
Conclusion
The FTLM STLM Indicator MT5 provides a powerful, visual momentum assessment to help traders recognize trend strength and potential reversals. By combining fast and slow trend line momentum, it delivers actionable insights for both trend-following and counter-trend strategies. Ideal for any trader looking to refine decision-making and improve market timing.
FAQ
2 Downloads
Published:
Mar 03, 2026 11:33 AM
Category: