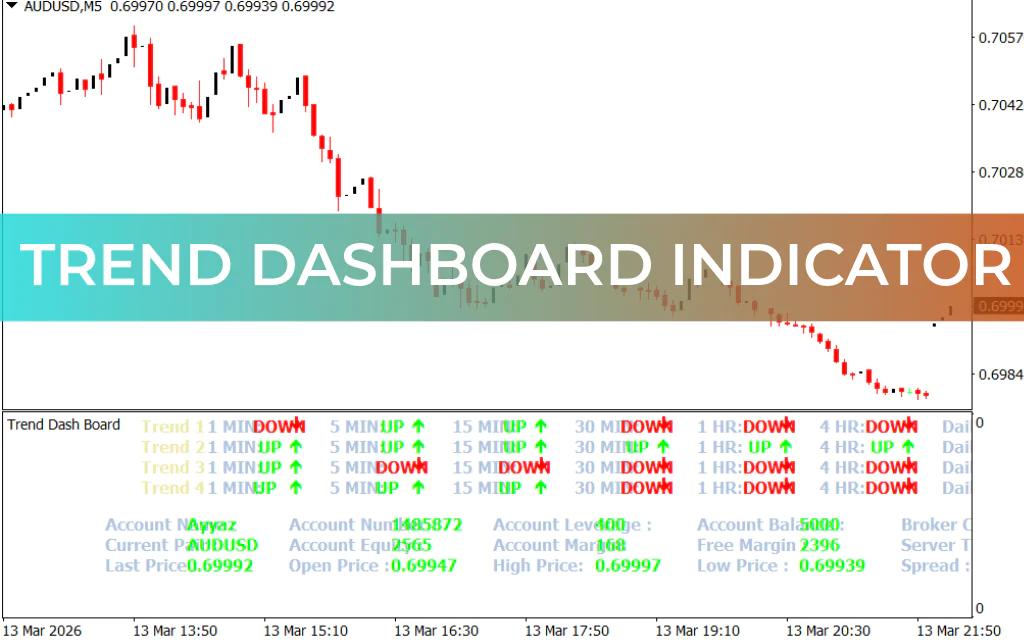
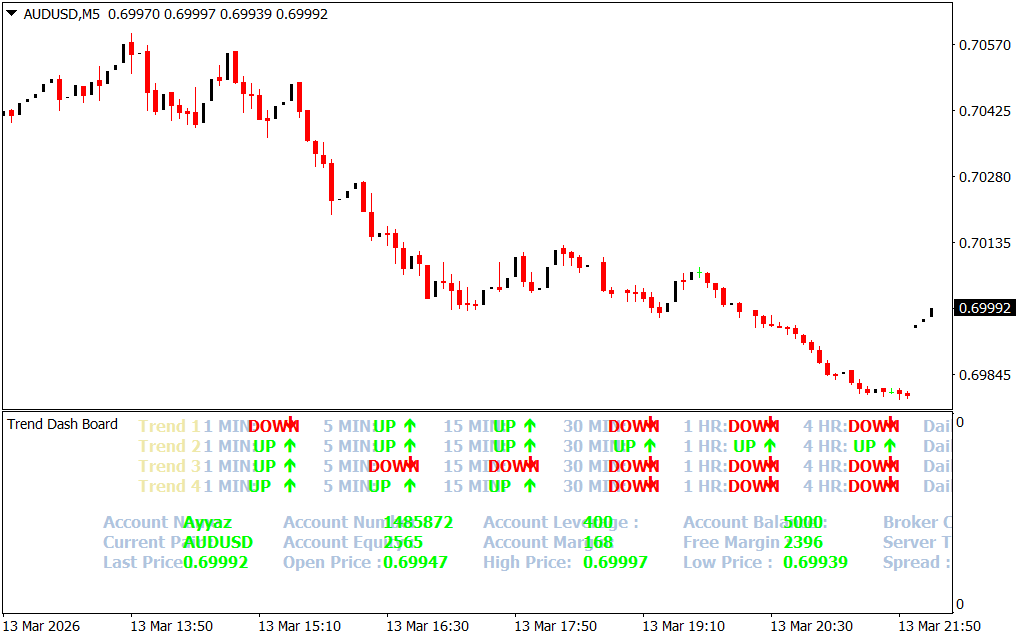
The Trend DashBoard Indicator for MT4 is a versatile tool that combines multiple technical indicators—MACD, Stochastic, Moving Averages, and RSI—to provide BULLISH or BEARISH trend information along with UP and DOWN arrow trading signals. It’s designed to help both novice and advanced forex traders make faster and more informed trade decisions.
Key Features of the Trend DashBoard Indicator
- Multi-indicator confluence – The dashboard consolidates trend information from MACD, Stochastic, Moving Averages, and RSI into a single panel. This allows traders to quickly spot agreement across multiple indicators for more reliable signals.
- Arrow signals – UP arrows (Lime) indicate potential BUY trades, while DOWN arrows (Red) signal potential SELL opportunities.
- Account and instrument info – Displays essential trading account details such as account name, balance, equity, margin, leverage, and also instrument data like last price, open/high/low, and spread.
- Multi-timeframe support – Works across intraday, daily, weekly, and monthly charts. You can combine trends from higher timeframes with lower timeframes for precise entries.
- Non-repainting signals – Once a candle closes, the arrow signals remain fixed, reducing the chance of false trades.
How to Trade Using the Trend DashBoard Indicator
Single-Timeframe Strategy
- Identify confluence – If at least three of the four indicators signal a bullish trend, open a BUY position.
- Set stop-loss – Place below the previous swing low.
- Sell signals – If three or more indicators signal a bearish trend, open a SELL position with stop-loss above the previous swing high.
- Take profit / exit – Based on your preferred risk-reward ratio or exit when the trend reverses.
Multi-Timeframe Strategy (MTF)
- Higher timeframe trend – Use daily or H4 to determine the main trend direction.
- Lower timeframe entries – Use M5, M15, or H1 to time entries with lower risk.
- Alignment – Enter trades only when lower timeframe signals align with the higher timeframe trend.
Pros and Cons
✅ Pros
- Combines multiple indicators in one panel for more reliable signals.
- Displays key account and instrument information directly on the chart.
- Works on all timeframes, from intraday to monthly.
- Non-repainting signals increase confidence in entries.
❌ Cons
- Can appear crowded with too much data for beginners.
- Arrow signals are best confirmed with Price Action or support/resistance levels.
- Slight lag in very volatile markets is possible.
FAQ
- Does it repaint?
No, once a candle closes, signals remain fixed. - Can I scalp with this indicator?
Yes, works well on M5 and M15, but confirmation from price action is advised. - Is it beginner-friendly?
Yes, but beginners may need time to interpret the dashboard data efficiently. - Can it be used on non-forex assets?
Yes, applicable to commodities, indices, and cryptocurrencies on MT4. - How to get the best results?
Look for confluence across at least three of the four indicators before opening a trade.
Conclusion
The Trend DashBoard Indicator for MT4 is a free and easy-to-install tool that consolidates multiple trend signals into a single panel. Its strength lies in combining MACD, RSI, Stochastic, and Moving Averages to generate reliable BUY/SELL signals. It is particularly effective when used with price action, support/resistance levels, or moving averages for confluence.
This indicator is ideal for traders looking for multi-indicator confirmation and a clear visual representation of trend direction across multiple timeframes.
FAQ
2 Downloads
Published:
Mar 15, 2026 19:15 PM
Category: