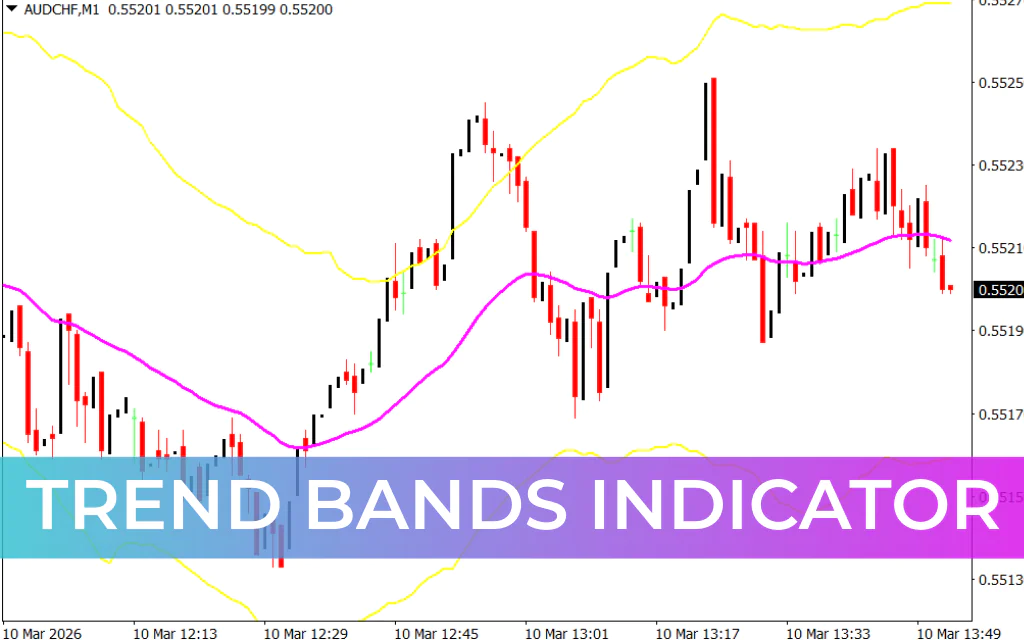
The Trend Bands Indicator for MT4 is a custom technical analysis tool designed to help traders follow market trends and measure price volatility. By creating a dynamic channel around the price, the indicator allows traders to quickly identify trend direction, potential reversal zones, and continuation patterns.
The indicator consists of three key bands that form a structured trading channel. These bands help traders visualize the overall market direction and determine potential entry and exit points.
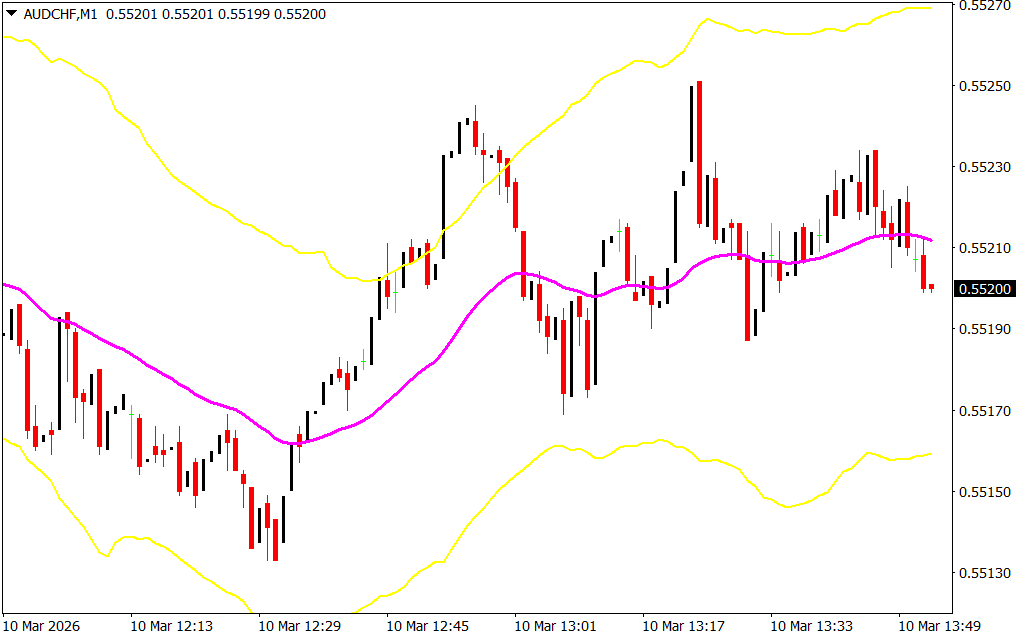
- Upper Yellow Band: Represents the upper volatility boundary and potential resistance zone.
- Lower Yellow Band: Represents the lower volatility boundary and potential support zone.
- Magenta Middle Band: Acts as a trend divider that determines whether the market is bullish or bearish.
When the price moves above the magenta band, it signals a bullish trend. Conversely, when the price moves below the magenta band, it indicates a bearish trend.
The Trend Bands Indicator is suitable for beginner, intermediate, and advanced traders. It also works across different trading styles, including Scalping, intraday trading, day trading, and swing trading.
How to Trade With the Trend Bands Indicator
When applied to a chart, the indicator creates a volatility-based channel that helps traders identify high-probability trading setups.
Before entering a trade, it is important to first determine the overall trend direction.
Buy Signal
A buy signal occurs when the price crosses above the magenta middle band and closes above it. This movement suggests that bullish momentum may be entering the market.
Steps for a buy trade:
- Confirm that the market is transitioning into a bullish trend.
- Wait for the price to cross and close above the magenta band.
- Enter a buy (long) position once the signal is confirmed.
Sell Signal
A sell signal occurs when the price crosses below the magenta middle band and closes below it, indicating potential bearish momentum.
Steps for a sell trade:
- Confirm that the market is shifting into a bearish trend.
- Wait for the price to cross and close below the magenta band.
- Enter a sell (short) position after confirmation.
Stop Loss and Take Profit Strategy
Proper risk management is important when using the Trend Bands Indicator.
- Stop Loss: Place it a few pips away from the entry point or beyond the recent swing high/low.
- Take Profit: Target the opposite yellow band, which often acts as a dynamic support or resistance level.
This approach helps traders capture price movements within the channel while maintaining controlled risk.
Improving Trade Accuracy
Although the Trend Bands Indicator provides useful trend signals, combining it with other tools can improve trading accuracy. Many traders use it together with:
- Price Action patterns
- Support And Resistance levels
- Momentum indicators like RSI or MACD
Using multiple confirmations helps reduce false signals and improves overall trading performance.
Conclusion
The Trend Bands Indicator for MT4 is an effective tool for identifying market trends, volatility, and potential trading opportunities. With its dynamic channel structure and clear trend signals, traders can easily determine when the market is bullish or bearish.
Suitable for both trend-following and reversal strategies, this indicator can help traders identify high-probability setups across multiple timeframes. Best of all, it is free to download and simple to install on the MetaTrader 4 platform.
FAQ
Published:
Mar 10, 2026 08:54 AM
Category: