The Three Stochastics 3 V6 Indicator for MT4 is a powerful tool that combines stochastic indicators from three different periods to identify forex trend direction. By aligning these three stochastics, traders can pinpoint bullish or bearish market momentum, making it easier to decide entry, stop-loss, and take-profit levels.
This indicator is simple to understand, making it suitable for both new and advanced traders. It works on all chart timeframes, supporting Scalping, intraday trading, and higher timeframe strategies, though it performs best on higher timeframes for more reliable signals.
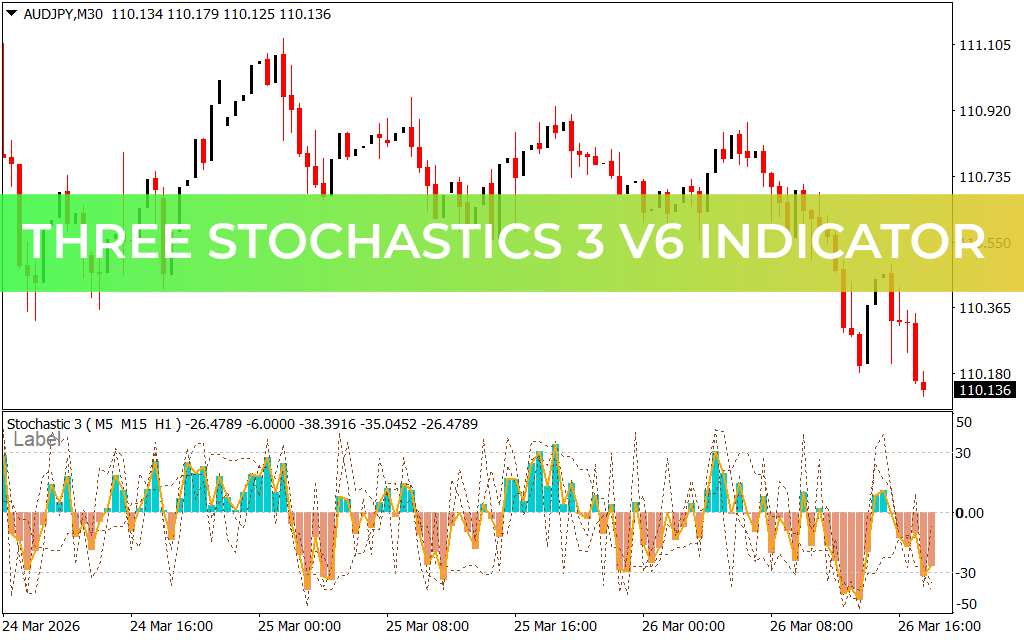
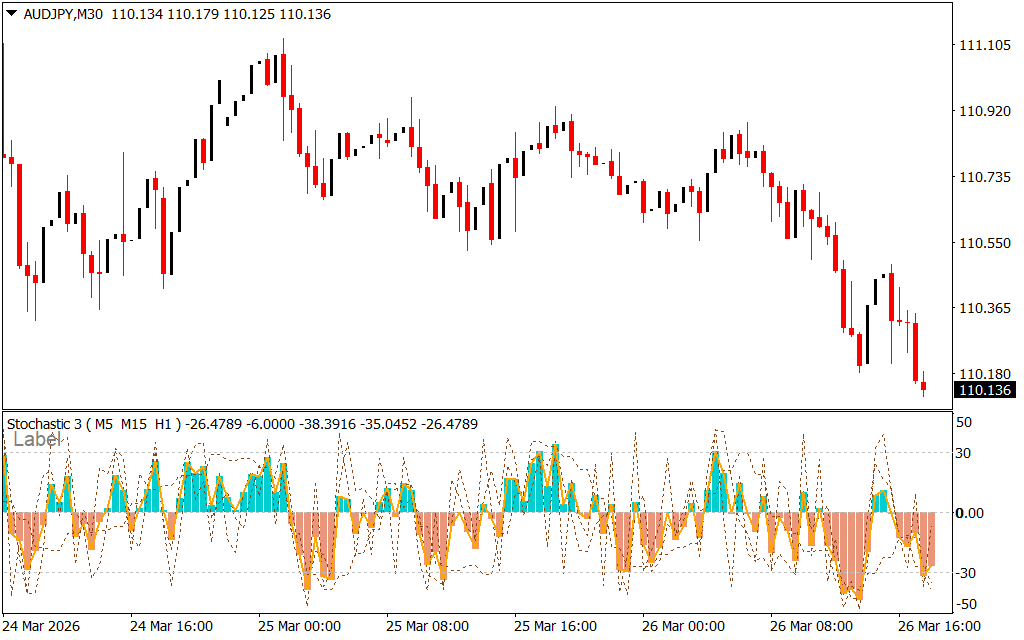
Features and Trading Signals
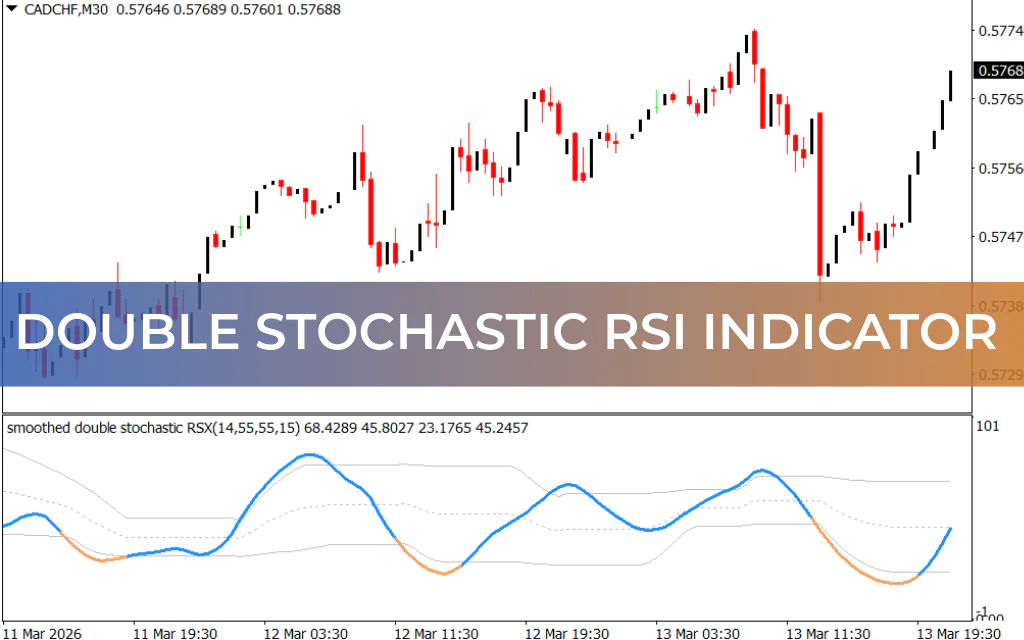
- Plots orange bearish histogram bars and turquoise bullish bars
- Oscillator bars are positioned around a ZERO line, with values ranging between +50 and -50
- Key levels are marked at +30 and -30 to identify extreme conditions
How to Trade with Three Stochastics 3 V6
- Trend-Following Strategy:
- Enter buy trades when histogram bars are bullish (turquoise) and place a stop-loss below the previous swing low.
- Exit when the histogram reaches above +30.
- Enter sell trades when histogram bars are bearish (orange) and exit near -30.
- Overbought/Oversold Reversal:
- Histogram values above +30 or below -30 indicate extreme market conditions, signaling potential reversals.
Important: The indicator generates reliable signals only when all three stochastic periods align in the same direction, confirming Trend Strength.
Conclusion
The Three Stochastics 3 V6 Indicator for MT4 is a versatile tool for identifying forex trends and reversals. Its multi-timeframe alignment ensures precise trading signals for trend-following and reversal strategies, helping traders improve accuracy and confidence.
FAQ
Published:
Mar 26, 2026 13:16 PM
Category: