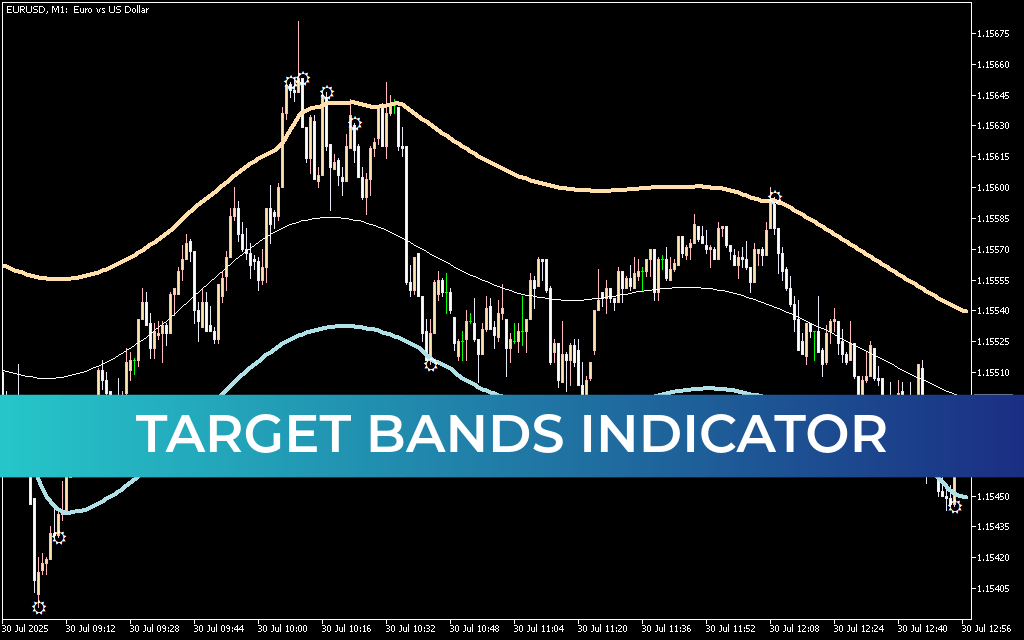
The Target Bands Indicator for MetaTrader 5 is a channel-based technical analysis tool designed to detect potential Trend Reversal zones. It plots upper and lower bands that represent exhaustion areas (overbought and oversold levels), where price is likely to reverse.
When price touches or exceeds either band, it signals a potential reversal. Additionally, price often returns back inside the channel after a breakout, offering mean-reversion trading opportunities.
The indicator is built on an algorithm that analyzes the previous 55 bars by default, evaluating historical price behavior to project optimal reversal zones. It also provides buy and sell signal stars directly on the chart:
- ⭐ Star below a candle → Buy signal
- ⭐ Star above a candle → Sell signal
This makes it particularly useful for scalpers and intraday traders, especially on lower timeframes like M15 and H1.
How the Target Bands Indicator Works
1️⃣ Channel Structure
- Upper Band → Overbought / Exhaustion zone
- Lower Band → Oversold / Exhaustion zone
- Price touching or breaking the bands suggests a possible reversal.
2️⃣ Signal Stars
- A buy star appears below the candle near the lower band.
- A sell star appears above the candle near the upper band.
3️⃣ Breakout and Return Principle
- If price breaks outside the band, it often returns to the channel.
- Sharp deviations beyond the band can signal exhaustion before reversal.
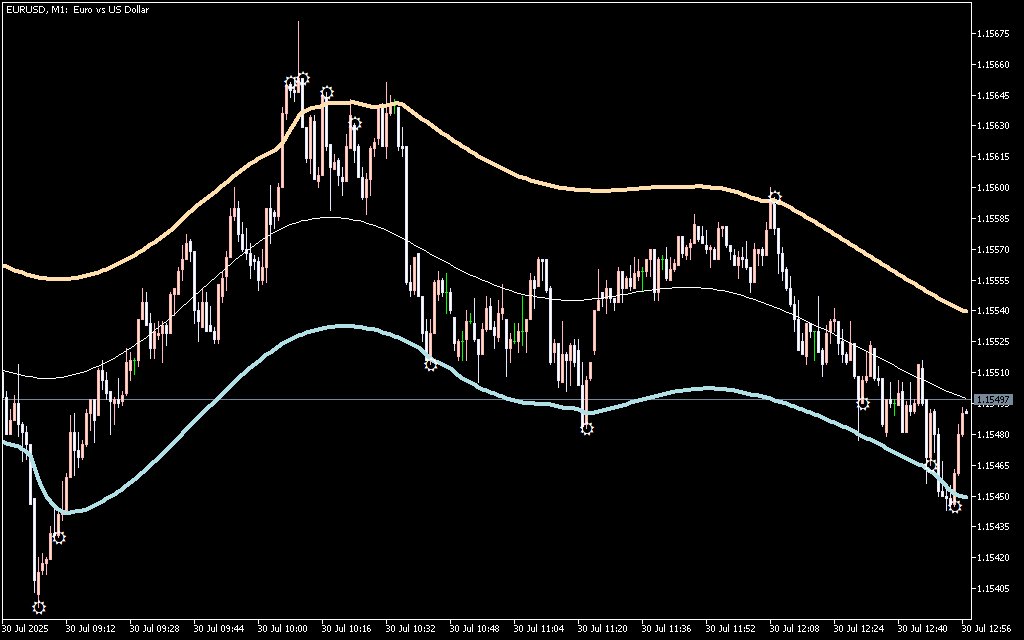
Example: EUR/USD on H1
Step-by-Step Setup
- Price breaks below the lower band with sharp deviation.
- Indicator prints a buy star.
- Price moves back inside the band.
- A bullish engulfing pattern forms, confirming entry.
At this point, a buy position can be considered with a stop loss below the recent swing low.
The same logic applies in reverse for sell setups near the upper band.
Trading Strategy Guidelines
📈 Buy Setup
- Price touches or breaks the lower band
- Buy star appears
- Confirm with bullish Price Action (e.g., engulfing pattern)
- Stop loss below recent swing low
📉 Sell Setup
- Price touches or breaks the upper band
- Sell star appears
- Confirm with bearish price action
- Stop loss above recent swing high
Best Practices
- Combine with price action analysis
- Use additional confirmation tools like RSI or volume
- Avoid trading against strong trends without confirmation
- Ideal for Scalping and intraday trading
Because the indicator is highly sensitive, using it alone may generate false signals in strong trending markets. Confluence with other tools improves accuracy.
Key Benefits
- Clearly identifies overbought and oversold zones
- Provides visual buy/sell entry stars
- Works well on intraday timeframes
- Suitable for Forex and other instruments
- Free to download and easy to use
Conclusion
The Target Bands Indicator for MT5 is a highly responsive channel-based tool for identifying potential trend reversals. By combining band exhaustion zones with entry stars and price action confirmation, traders can locate high-probability setups. For best results, use it alongside other technical indicators to strengthen trade decisions.
FAQ
4 Downloads
Published:
Mar 04, 2026 16:29 PM
Category: