The Synergy TDI (Traders Dynamic Index) Indicator for MetaTrader 4 (MT4) is a versatile technical indicator that helps traders understand the underlying market condition of any tradable asset. By combining multiple indicators into a single tool, it provides actionable insights for various trading strategies.
What Is the Synergy TDI Indicator?
The TDI Indicator merges the following elements:
- Relative Strength Index (RSI) – Measures market momentum
- Moving Average (MA) – Identifies trend direction
- Bollinger Bands (BB) – Determines volatility and overbought/oversold zones
This combination allows the Synergy TDI to display market sentiment, volatility, momentum, and potential reversal zones all in one indicator.
Why Use TDI?
The Synergy TDI Indicator is effective because it:
- Identifies overbought and oversold zones
- Highlights bullish and bearish momentum
- Detects divergences and pattern formations like M and W patterns
- Is suitable for Scalping, intraday, and swing trading
- Works for both beginner and experienced traders
How to Trade With the Synergy TDI Indicator
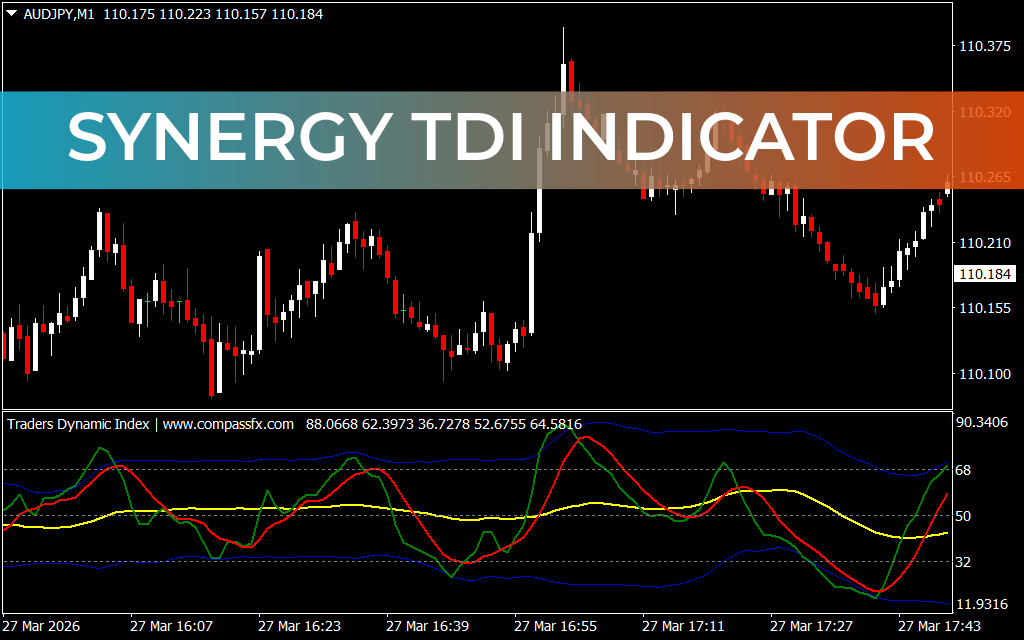
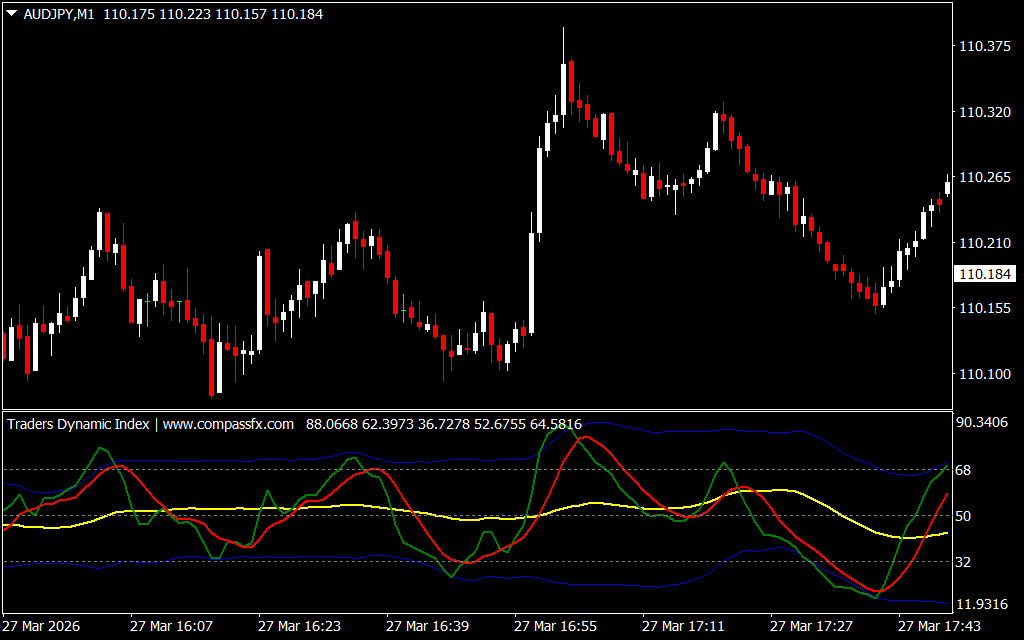
The indicator uses four color-coded lines:
- Medium Blue Line: Upper/lower limits for overbought/oversold
- Yellow Line: Market baseline
- Green Line: RSI price line
- Red Line: Trade signal line
BUY Signal Setup
- Price reaches the oversold zone
- Yellow baseline rises above level 50
- Red signal line and Green RSI line cross above the Yellow line → enter BUY/LONG
SELL Signal Setup
- Price reaches the overbought zone
- Yellow baseline falls below level 50
- Red signal line and Green RSI line cross below the Yellow line → enter SELL/SHORT
Key Benefits
- Combines RSI, Moving Average, and Bollinger Bands in one tool
- Identifies high-probability trade setups
- Works on any timeframe and instrument
- Suitable for all types of traders
- Free and easy to download
Conclusion
The Synergy TDI Indicator for MT4 is an intuitive and multi-functional tool that simplifies decision-making by providing a complete picture of market conditions. Its combination of RSI, Moving Average, and Bollinger Bands makes it ideal for both beginners and advanced traders looking to identify high-probability setups.
FAQ
Published:
Mar 28, 2026 19:25 PM
Category: