The Synergy Pro ASR Indicator for MT4 is a technical analysis tool designed to help traders identify key Support And Resistance zones in the forex market. These levels are crucial in trading because they often act as turning points where price may reverse or continue its trend.
The indicator works by detecting recent swing highs and swing lows, which often become dynamic support and resistance areas. These zones can help traders anticipate potential price reactions and plan their trades accordingly.
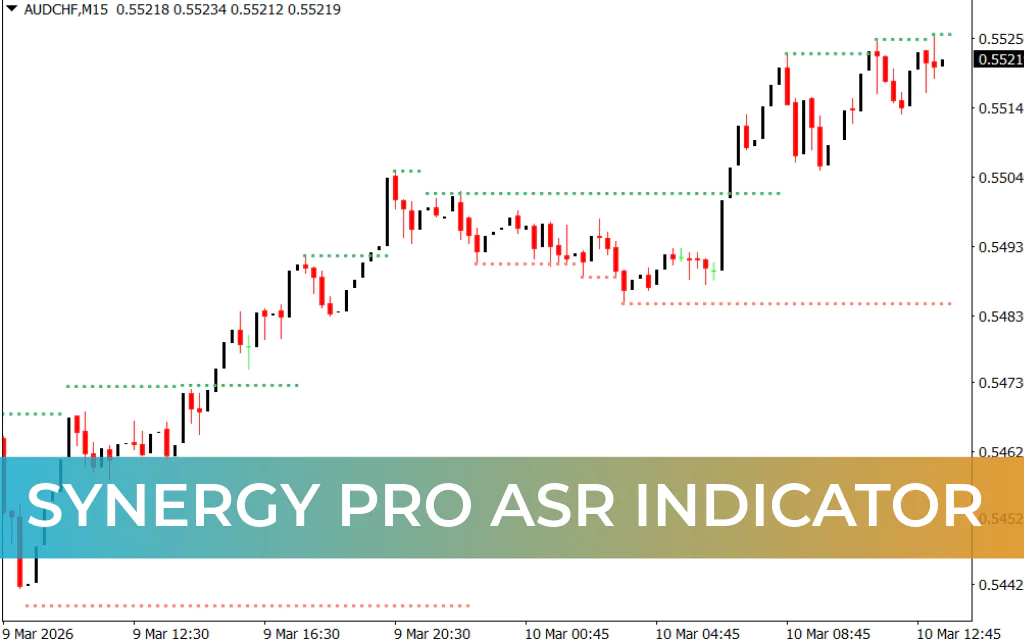
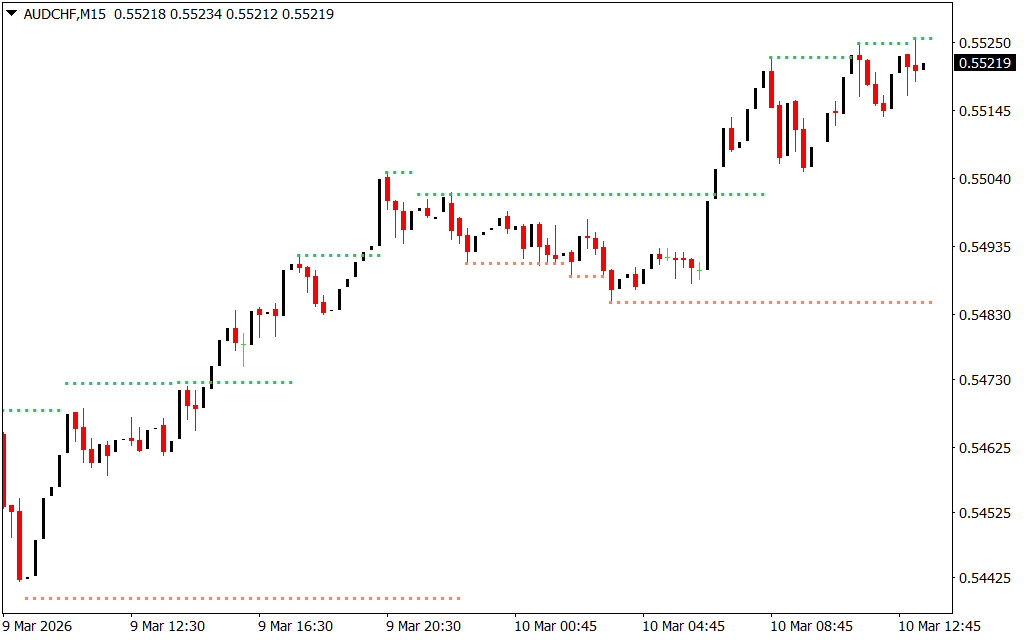
On the chart, the Synergy Pro ASR Indicator displays dotted horizontal lines in two colors:
- Sea green lines represent resistance levels.
- Salmon-colored lines represent support levels.
These levels provide traders with clear visual zones where price may either reverse direction or break through to continue the trend.
The indicator is suitable for all levels of traders, including beginners, intermediate traders, and advanced professionals. It can also be used for multiple trading styles such as Scalping, intraday trading, day trading, and swing trading.
How to Trade With the Synergy Pro ASR Indicator
When applied to an MT4 chart, the Synergy Pro ASR Indicator highlights potential support and resistance zones based on recent price swings. Traders can use these levels to identify Trend Reversal or breakout opportunities.
For better accuracy, it is recommended to combine this indicator with Price Action analysis or other technical indicators.
Trading Reversals
One common way to use the indicator is to look for price bounces from support or resistance zones.
- When the price approaches a support level and begins to bounce upward, traders may consider opening a buy position.
- When the price approaches a resistance level and starts moving downward, traders may consider opening a sell position.
These setups are especially useful for traders who specialize in trend reversal strategies.
Trading Breakouts
Another popular strategy is to trade breakouts and retests of support and resistance zones.
For example:
- If the price breaks below a support level and later retests it, the previous support may turn into new resistance.
- Traders can then look for a sell opportunity after the retest.
Similarly:
- If the price breaks above a resistance level and retests it, that resistance may become new support.
- Traders can consider opening a buy position after confirmation.
This principle follows a well-known market rule: broken support often becomes resistance, and broken resistance becomes support.
Example Trading Scenario
In a typical breakout scenario, traders may wait for the price to break a support level. After the breakout, the price may return to retest that same level.
If the level holds as resistance during the retest, traders can open a sell trade, expecting the market to continue moving downward.
This approach is widely used in trend continuation strategies.
Conclusion
The Synergy Pro ASR Indicator for MT4 is a useful tool for identifying important support and resistance zones that can signal potential trend reversals or continuation opportunities. By highlighting recent swing levels, the indicator helps traders quickly locate key price areas on the chart.
When combined with price action and other technical indicators, the Synergy Pro ASR Indicator can significantly improve trade timing and decision-making. Best of all, it is free to download and easy to use on the MetaTrader 4 platform.
FAQ
2 Downloads
Published:
Mar 10, 2026 08:48 AM
Category: