Free
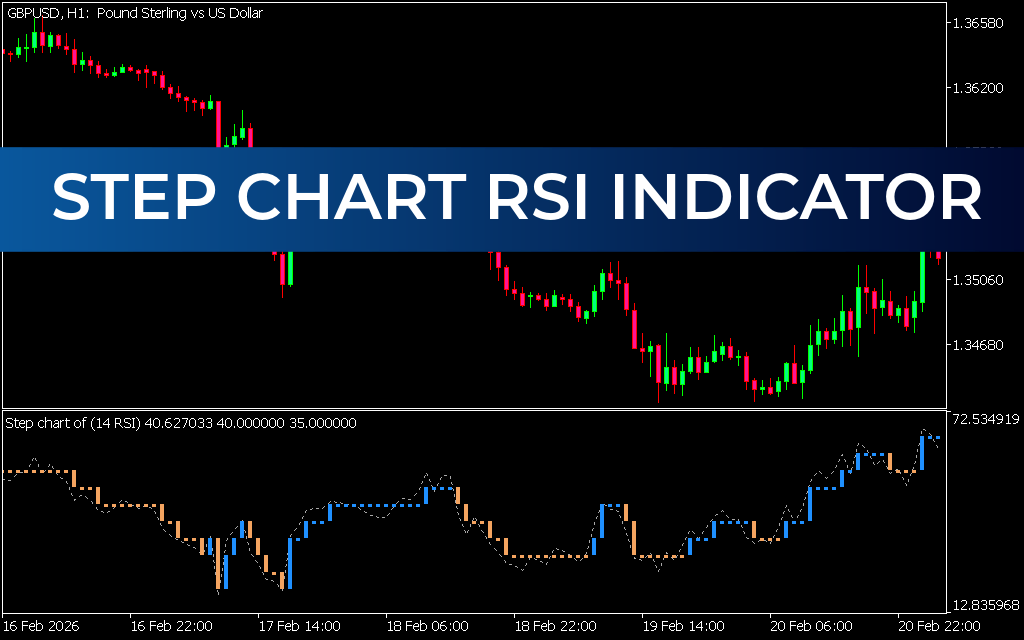
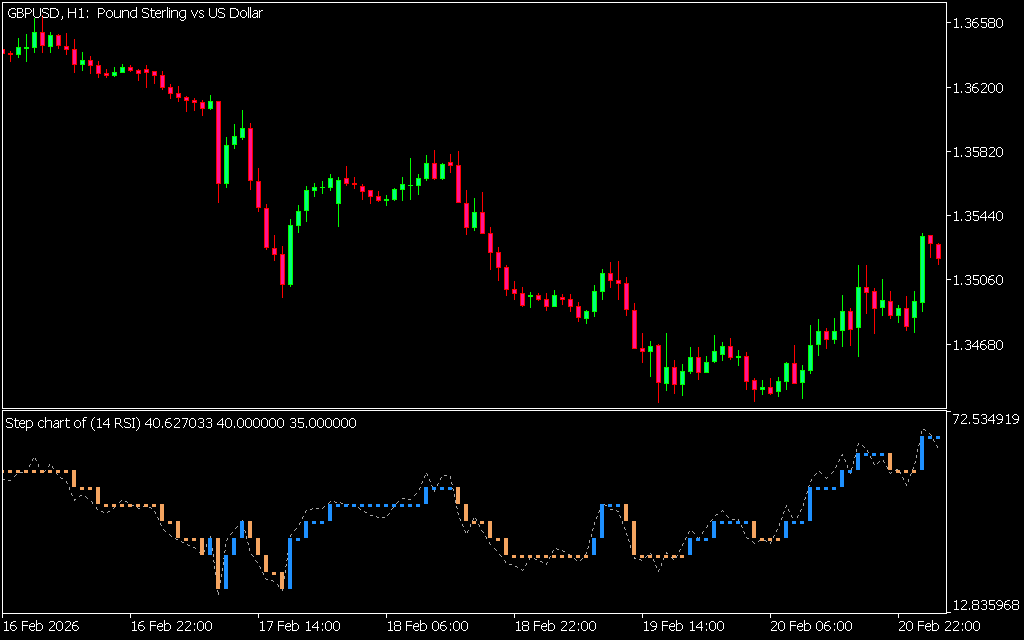
The Step Chart RSI Indicator for MetaTrader 5 (MT5) is an enhanced version of the classic Relative Strength Index (RSI). By adding a step filter and a moving average line, it eliminates many false signals that traders often encounter when using RSI alone. This makes it a more reliable tool for identifying overbought and oversold conditions in the Forex market.
Key Features
- Dual-Line Display: Blue RSI line and orange signal line for clarity.
- Step Filter: Reduces false starts and improves signal quality.
- Multi-Timeframe Utility: Works across intraday and long-term charts.
- Beginner-Friendly: Simple design and easy-to-interpret signals.
How to Trade with Step Chart RSI
- Buy Signal: When the RSI line crosses above the signal line after reaching oversold levels (below 30), traders can enter a long position. Place a stop loss below the previous swing low and aim for profit near the opposite overbought level.
- Sell Signal: When the RSI line crosses below the signal line after reaching overbought levels (above 70), traders can enter a short position. Place a stop loss above the previous swing high and target profits near the opposite oversold level.
- Confirmation Strategy: Always confirm signals with Price Action or other technical indicators to improve accuracy.
Benefits
- Filters out false RSI signals.
- Provides clearer entry and exit points.
- Suitable for both new and experienced traders.
- Enhances decision-making when combined with other tools like moving averages or support/resistance levels.
Conclusion
The Step Chart RSI Indicator for MT5 is a powerful upgrade to the classic RSI. By applying filters and a moving average, it helps traders avoid false signals and make more accurate trading decisions. Best of all, it can be downloaded for free.
2 Downloads
Published:
Apr 05, 2026 02:56 AM
Category:
Share: