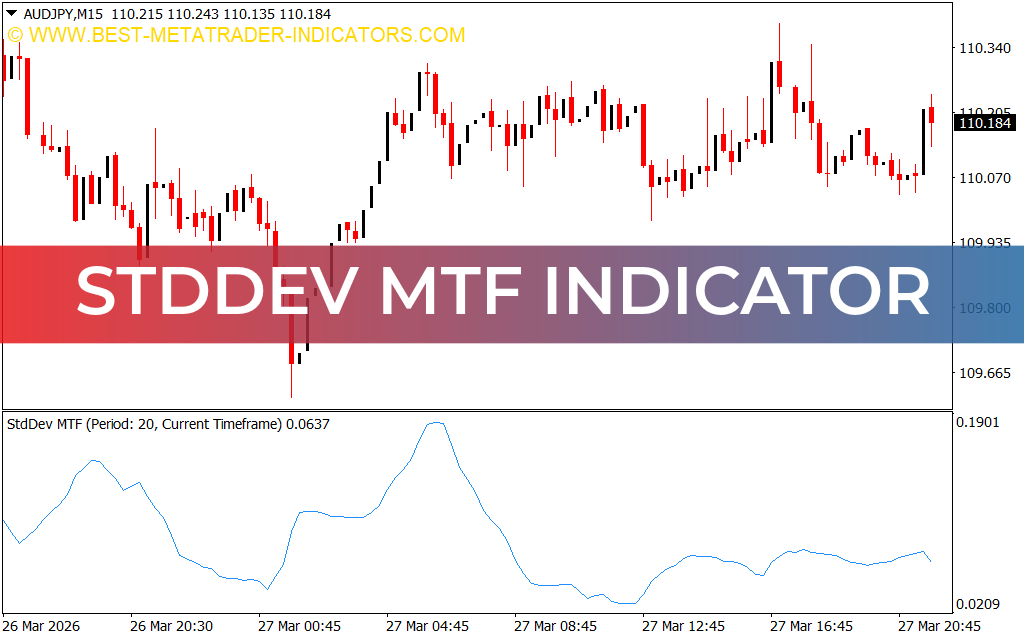
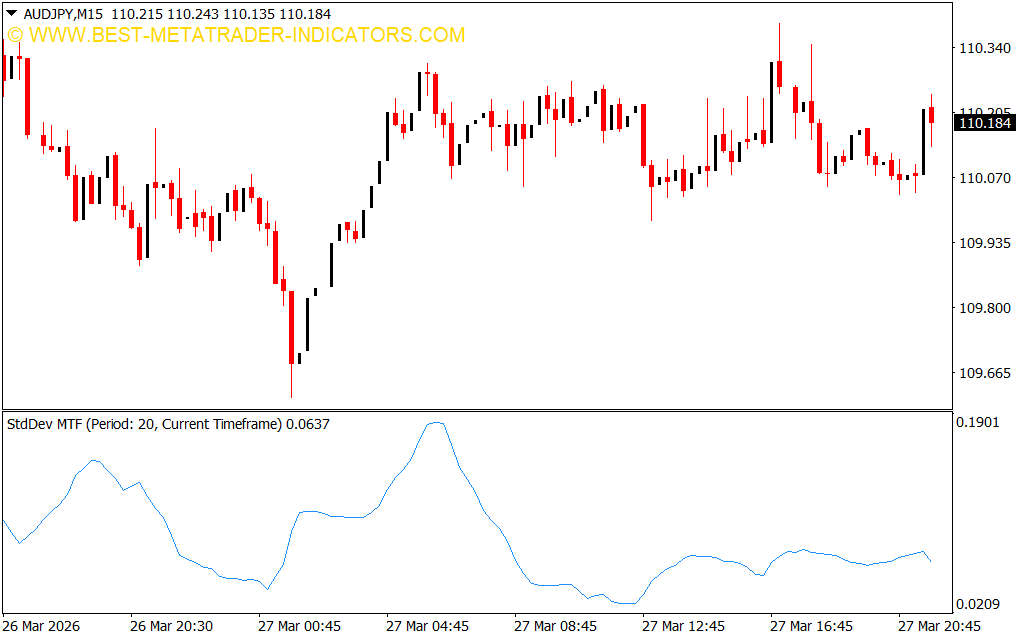
The StdDev MTF Indicator for MT4 is a versatile oscillator designed to measure market volatility using standard deviation. It provides overbought and oversold conditions, helping traders identify trend direction, reversals, and breakout opportunities across multiple timeframes.
Key Features of StdDev MTF
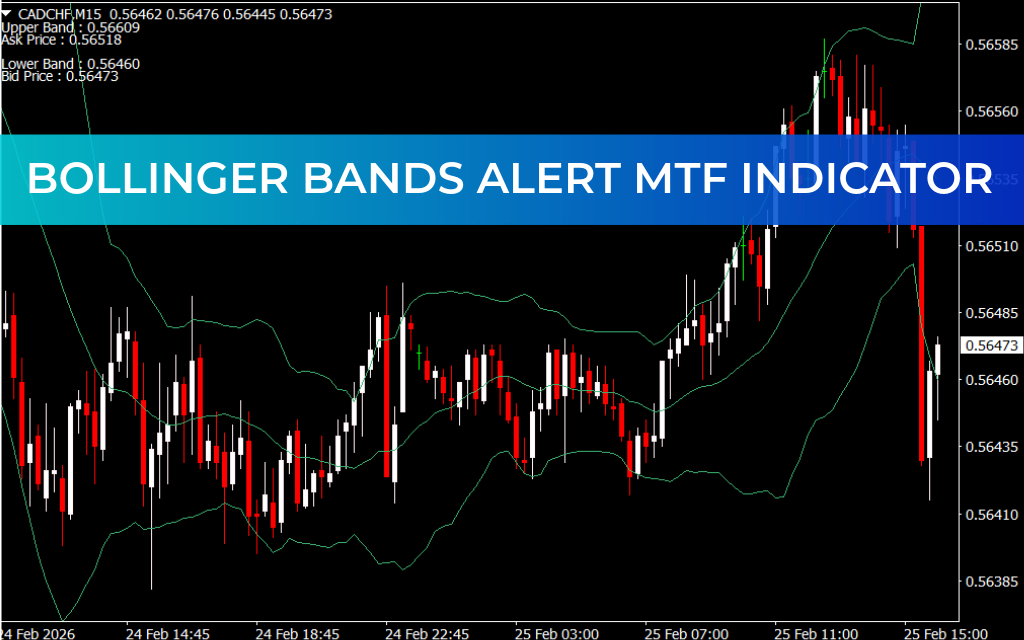
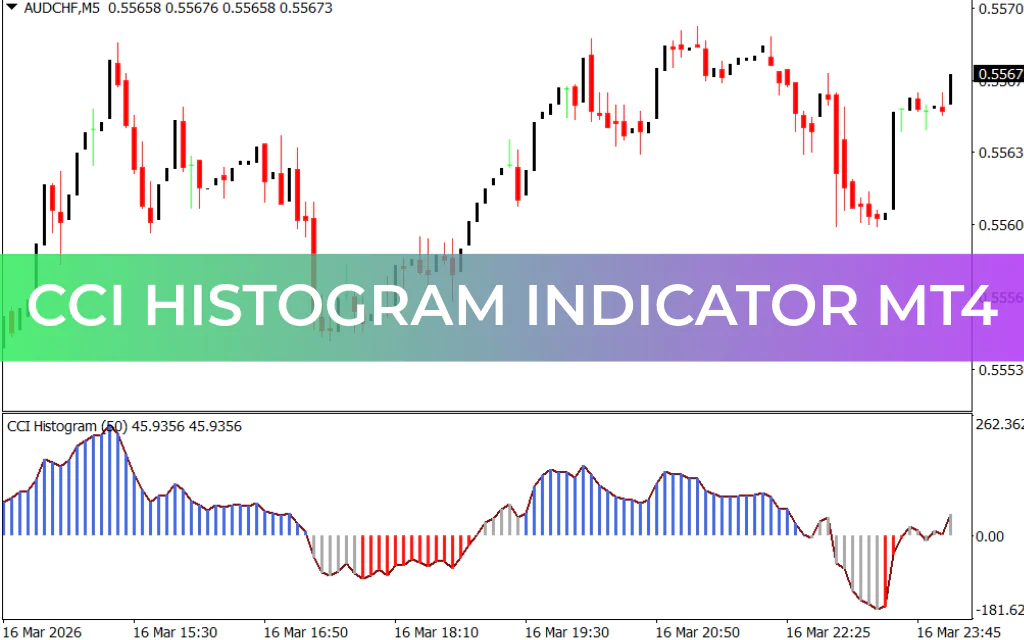
- Single-Line Oscillator: Plots a clear line that oscillates around zero, indicating volatility relative to a simple moving average.
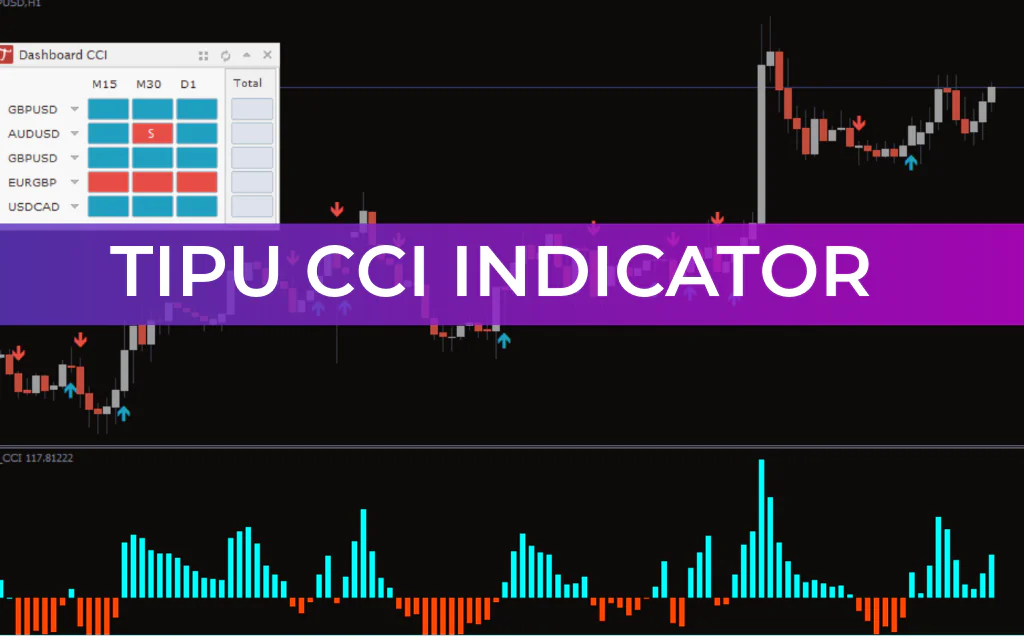
- Multi-Timeframe Use: Works effectively on all timeframes, with higher timeframes generally offering more reliable signals.
- Trend and Reversal Signals: Can be used as a trend filter or to spot potential reversals and breakouts.
How to Trade with StdDev MTF
The indicator helps determine market bias and trade entry points:
- Bullish Trend: Indicator value above zero signals an upward trend. Look for bullish candle closes after oversold conditions for long entries.
- Bearish Trend: Indicator value below zero indicates a downward trend. Enter short positions when the line peaks and turns downward, confirmed by bearish candle closes.
- Overbought/Oversold Reversals: Use the extremes of the indicator in combination with candlestick patterns to trade potential market reversals.
By combining StdDev MTF signals with Price Action and other indicators, traders can enhance entry accuracy and reduce the likelihood of false signals.
Why Traders Use StdDev MTF
The StdDev MTF Indicator for MT4 is valued for its ability to analyze volatility, detect trend direction, and identify potential reversals. Its flexibility and simplicity make it suitable for both new and advanced forex traders.
Conclusion
In summary, the StdDev MTF Indicator for MT4 is a multi-purpose tool for trend analysis, volatility measurement, and reversal trading. Proper backtesting and signal confirmation can significantly improve trading performance.
FAQ
Published:
Mar 27, 2026 19:16 PM
Category: