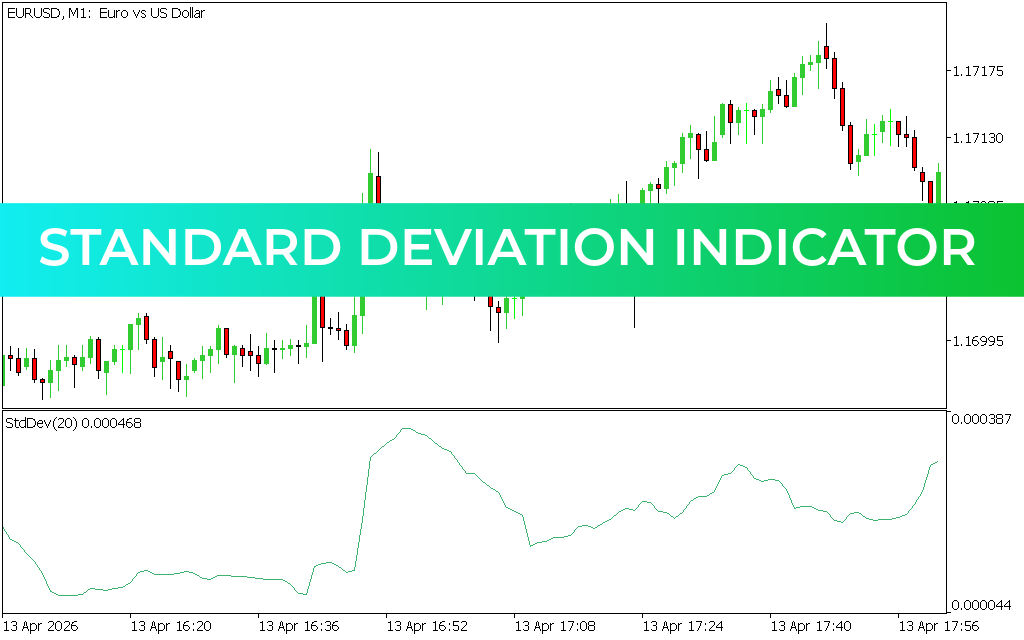
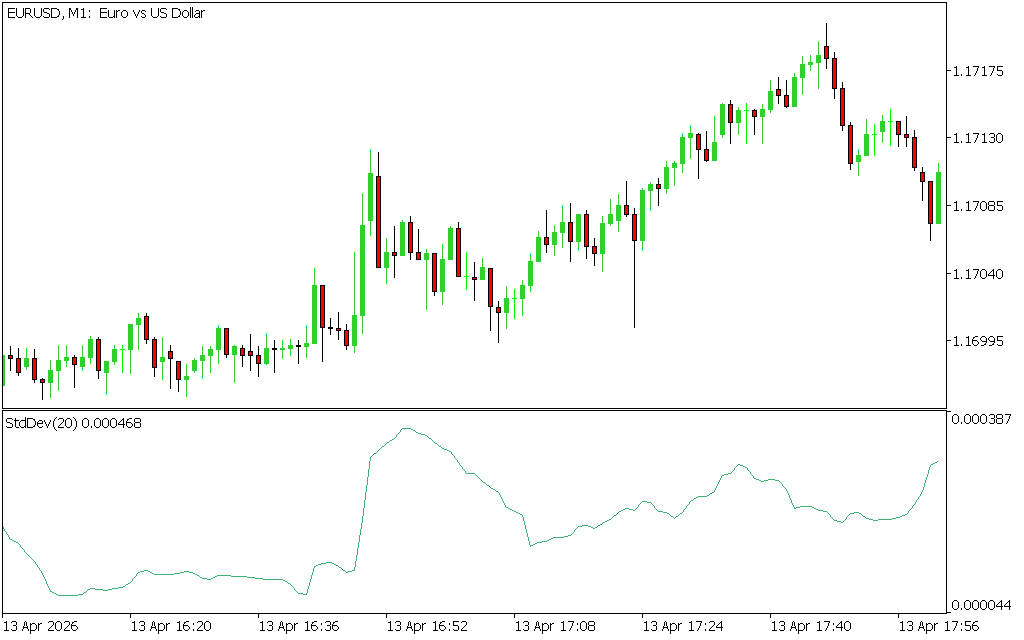
The Standard Deviation Indicator for MetaTrader 5 (MT5) is a technical volatility tool that measures market activity based on price deviation from a moving average. It helps traders identify whether the market is in a calm (low volatility) phase or an active (high volatility) phase, making it useful for timing breakouts and avoiding sideways conditions.
Unlike trend indicators, the Standard Deviation tool focuses purely on volatility strength, not direction.
What Is the Standard Deviation Indicator?
The Standard Deviation (SD) Indicator evaluates how far price deviates from its average value over a selected period. It is based on statistical principles and compares current price movement to a moving average baseline.
Market interpretation:
- 📉 Low SD values: Market is inactive or ranging (low volatility)
- 📈 High SD values: Market is active with strong movement (high volatility)
This helps traders understand when the market is “resting” and when it is preparing for a potential breakout.
How the Standard Deviation Indicator Works
The indicator measures the distance between:
- Current price
- Selected Moving Average (SMA or similar baseline)
It then plots a line showing how much price is deviating from that average.
Key concept:
- The more price moves away from the average → higher volatility
- The closer price stays to the average → lower volatility
Market Phases Identified by SD Indicator
🔹 1. Low Volatility (Flat Market)
- SD line remains low and stable
- Market is consolidating
- No strong directional movement
👉 Traders typically wait for breakout confirmation
🔹 2. Rising Volatility (Expansion Phase)
- SD line starts increasing
- Market activity intensifies
- Price prepares for strong movement
👉 Often signals upcoming breakout opportunities
🔹 3. High Volatility Peak
- SD reaches high levels
- Strong trend or impulsive move occurs
- Market becomes highly active
🔹 4. Declining Volatility
- SD line begins falling
- Market slows down after strong move
- Possible consolidation or reversal phase
How to Trade Using Standard Deviation
The SD indicator does not give direct buy/sell signals. Instead, it helps confirm when to trade and when to stay out of the market.
Buy Strategy (Volatility Expansion + Confirmation)
Conditions:
- Market is in a low volatility (flat) phase
- SD indicator begins to rise sharply
- Bullish candle confirmation appears
Entry plan:
- Enter BUY after breakout from consolidation
- Place stop-loss below recent swing low
- Target next resistance level
Sell Strategy (Volatility Expansion + Confirmation)
Conditions:
- Market is in a stable low-volatility phase
- SD line rises indicating expansion
- Bearish confirmation candle appears
Entry plan:
- Enter SELL after breakdown below range
- Place stop-loss above recent swing high
- Take profit at next support zone
Why Standard Deviation Is Useful in Trading
The SD indicator helps traders:
- Identify breakout zones before major moves
- Avoid trading during low-activity market conditions
- Confirm volatility expansion phases
- Improve timing of entry and exit decisions
Best Trading Conditions
The Standard Deviation Indicator works best in:
- 📊 Breakout trading strategies
- 📈 Trend-following systems
- 📉 Volatility-based setups
- ⏱ Intraday and swing trading
Advantages of Standard Deviation Indicator
- Simple volatility measurement tool
- Helps identify breakout opportunities
- Works across all forex pairs and timeframes
- Useful for filtering low-quality trades
- Based on reliable statistical principles
Limitations
- Does not provide direction (only volatility)
- Requires additional indicators for entry confirmation
- Can give delayed signals during sudden spikes
- Not suitable as a standalone trading system
Final Thoughts
The Standard Deviation Indicator for MT5 is a powerful volatility analysis tool that helps traders understand market activity levels. By identifying when the market is quiet or highly active, it allows traders to better prepare for breakouts, trend continuation, or consolidation phases.
However, it should always be used alongside trend indicators, Price Action, or support/resistance analysis to build a complete trading strategy.
Published:
Apr 13, 2026 12:49 PM
Category: