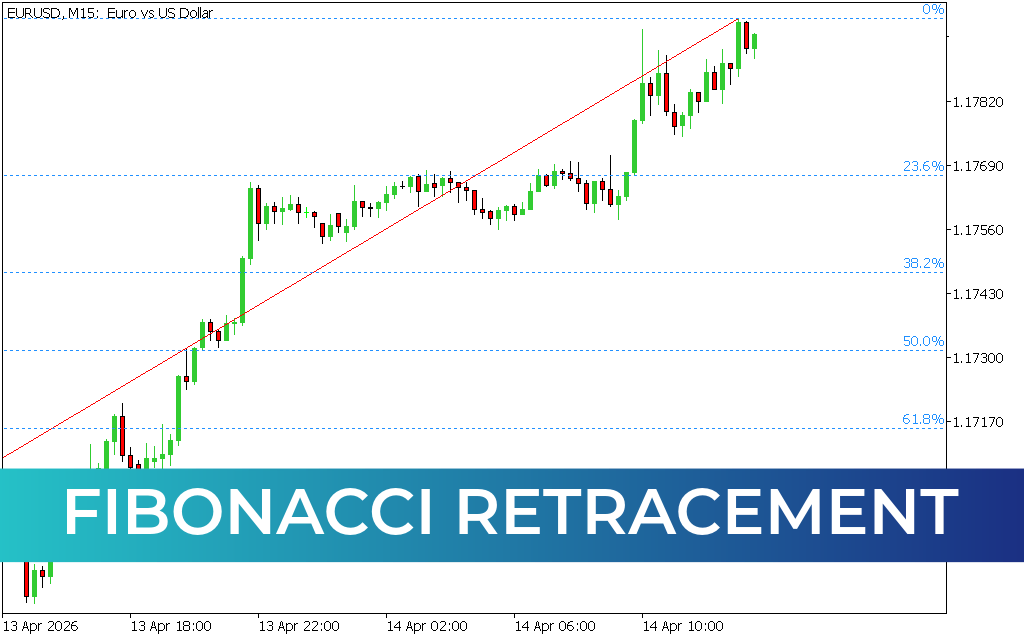
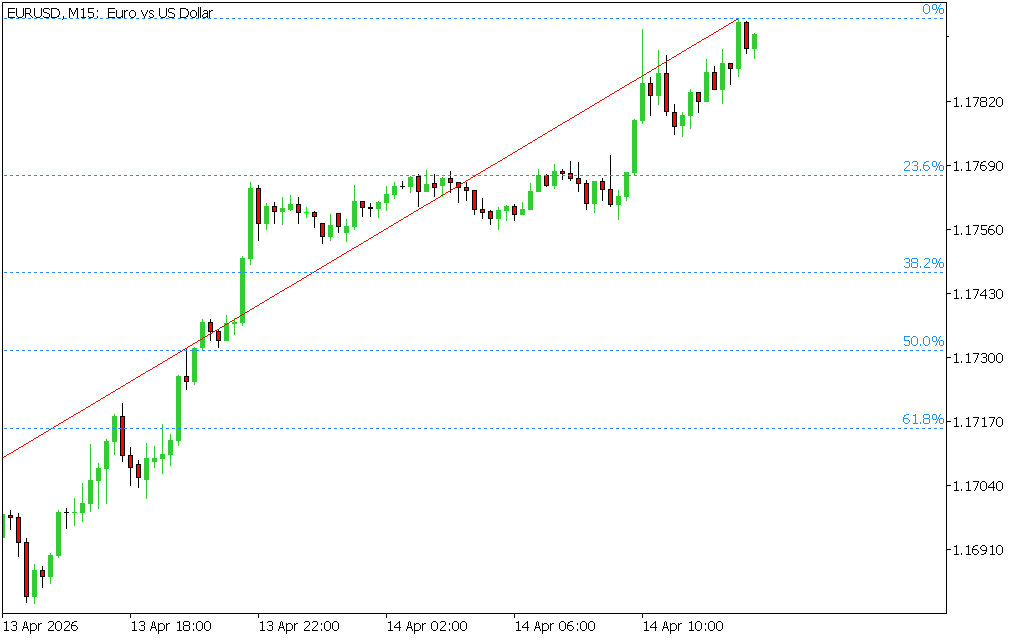
In the highly volatile Forex market, distinguishing between trend waves and retracements can be challenging. To address this issue, traders can rely on a powerful and free Fibonacci Retracement indicator designed specifically for MT5. This tool simplifies market analysis by automatically identifying key levels and filtering out market noise.
In this guide, you’ll learn how the indicator works, how Fibonacci levels are calculated, and how to use it effectively in your trading strategy.
1. What Is the Fibonacci Retracement Indicator?
The Fibonacci Retracement indicator is an automated technical analysis tool that plots Fibonacci levels directly on your MT5 chart. Unlike manual tools, it eliminates the need for guesswork by focusing only on active price movements and ignoring flat or sideways market conditions.
This indicator uses Fibonacci extensions to measure potential retracement depths within a trend. These levels help traders identify key pivot points where the price is likely to reverse and continue in the direction of the main trend.
2. Understanding Fibonacci Levels
Fibonacci levels are expressed as percentages and are derived from the Fibonacci sequence. The most important levels used in trading include:
- 100% – The starting point of the trend
- 61.8% – Known as the “golden ratio,” a strong support/resistance zone
- 50.0% – A common reversal level where traders often take profits
- 38.2% – Indicates strong trend momentum and trader confidence
- 23.6% – Shallow retracement level, less commonly used for entries
- 0% – The endpoint of the retracement range
While some tools include the 78.6% level, this indicator excludes it because price reversals typically occur at higher levels before reaching that depth.
Key Insights:
- Weak retracements after a strong trend often signal trend continuation
- Deep pullbacks may indicate a potential Trend Reversal
- Confluence with round numbers or other indicators increases accuracy
3. How to Use the Fibonacci Retracement Indicator
For best results, use the Fibonacci Retracement indicator as part of a broader trading system. Combining it with other tools increases the reliability of your signals.
Example Strategy with Trend Lines:
Pair the indicator with a trend line tool such as AutoTrendLines:
- When price retraces to 50% or 61.8% levels and slows down, it may signal a reversal
- A trend line can confirm whether the trend is likely to continue
- Place Stop Loss beyond the trend line for better risk management
Buy Scenario:
- If retracement stops near 38.2%, it indicates strong bullish sentiment
- Traders may enter a buy position at market price
- Place Stop Loss below the support level
Sell Scenario:
- If retracement reaches 50%–61.8%, it may indicate a bearish reversal
- Enter sell positions once confirmation signals appear
- Place Stop Loss above resistance or trend line
Key Benefits of the Indicator
- Fully automated Fibonacci level plotting
- Filters out low-volatility (flat) market conditions
- Works across all timeframes (Scalping, intraday, long-term)
- Helps identify high-probability reversal zones
- Enhances market sentiment analysis
Note: If levels do not update when switching timeframes, simply reapply the indicator to refresh it.
Final Thoughts
The Fibonacci Retracement indicator is a valuable tool for traders looking to improve their technical analysis. By identifying key support and resistance levels, it helps traders make more informed decisions and better anticipate market movements.
Whether you’re a beginner or an experienced trader, incorporating this indicator into your strategy can significantly improve your ability to spot profitable opportunities in the Forex market.
4 Downloads
Published:
Apr 14, 2026 06:33 AM
Category: