The Squeeze Break Indicator for MetaTrader 5 (MT5) is a trend and volatility-based trading tool inspired by the strategy in Mastering Trading by John Carter. This indicator helps traders identify trend beginnings and continuations by analyzing changes in market volatility, making it effective for both Forex and stock markets
.
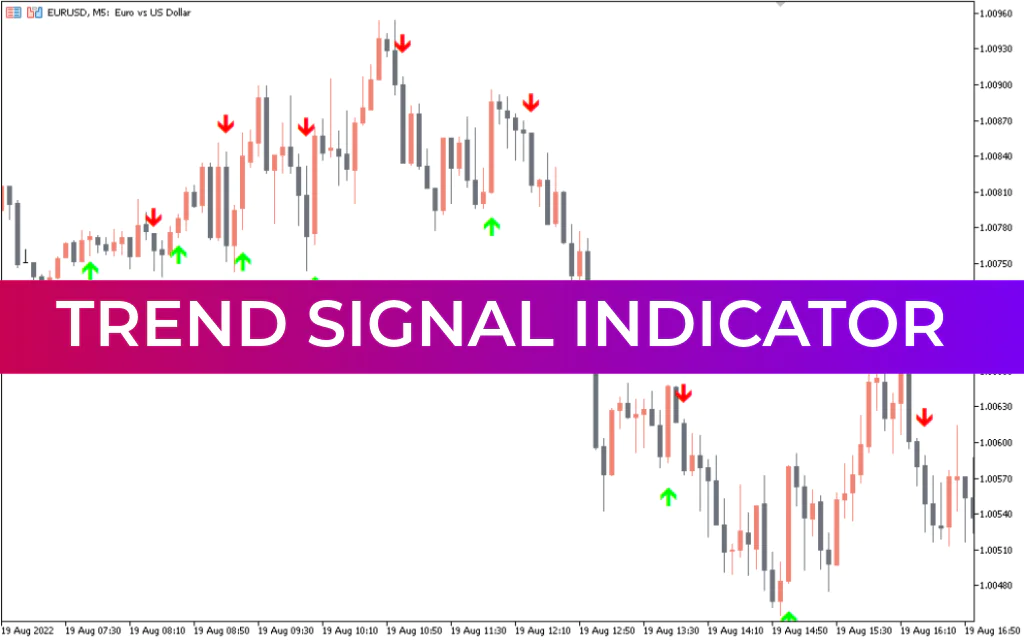
It is ideal for traders who want to enter at the start of bullish trends, short at the start of bearish trends, and ride the trend until it stabilizes.
Key Features of the Squeeze Break Indicator
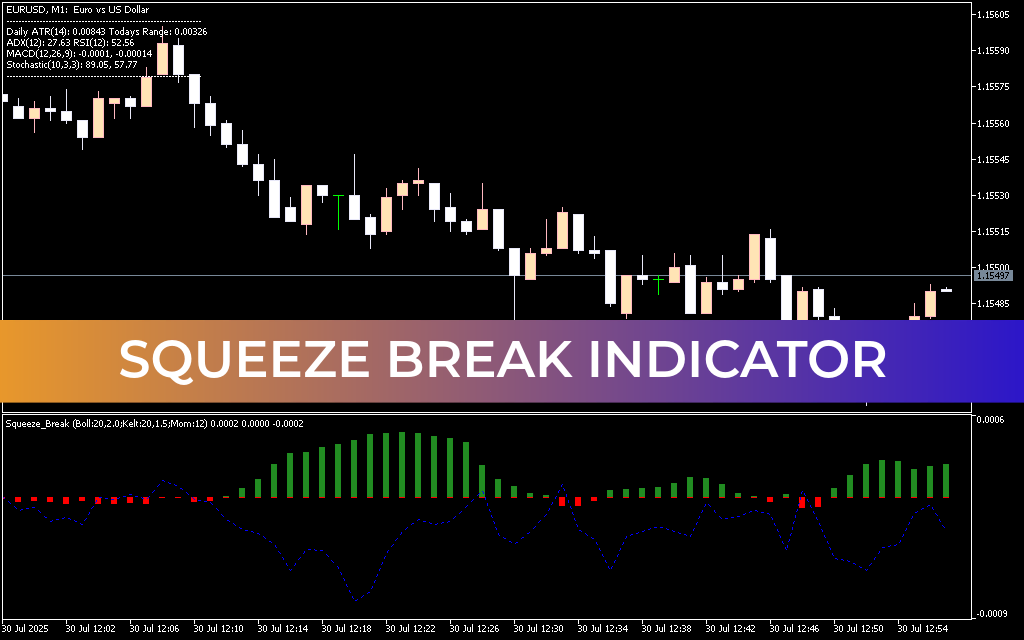
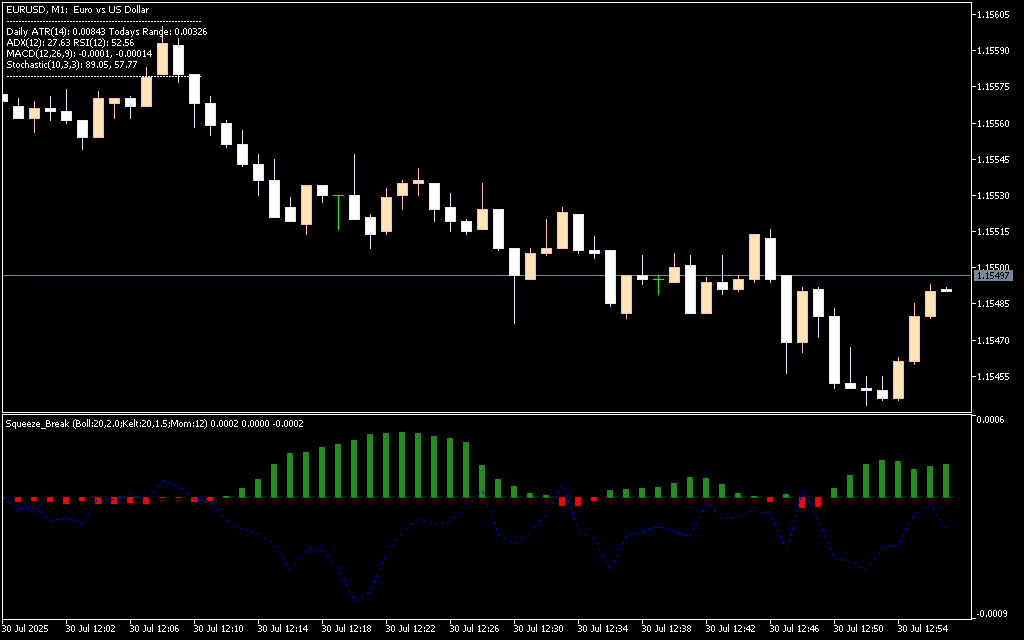
Histogram – Trend Presence
- Green bars: Trend is present and continuing
- Red bars: No trend (market stabilization or low volatility)
- Bar length: Indicates the strength of the trend – longer bars = stronger trend
The histogram visually represents the trend’s intensity, allowing traders to time entries and exits effectively.
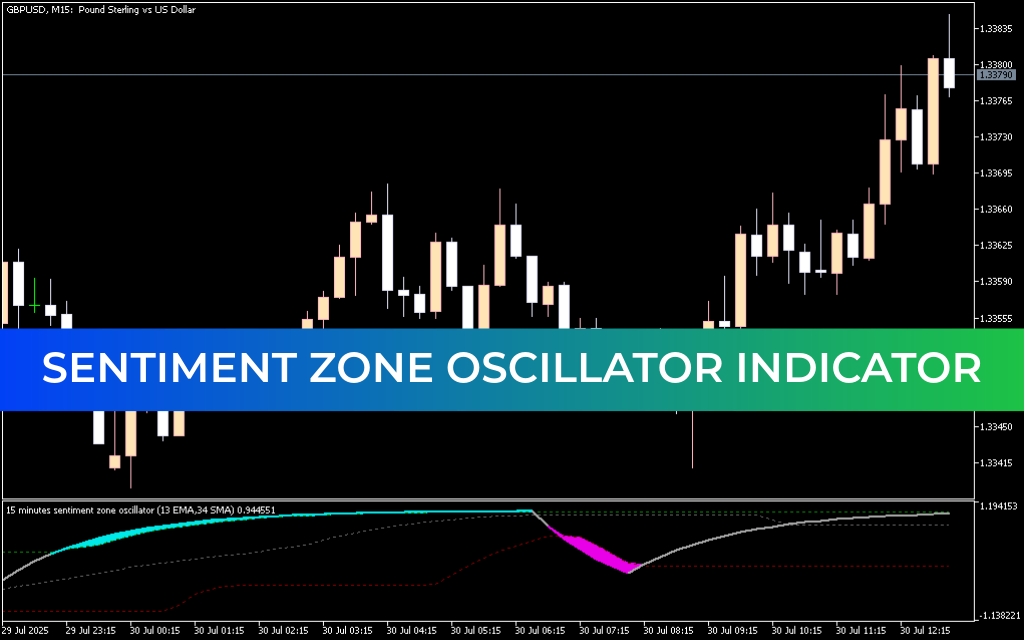
Blue Oscillator Line – Trend Direction
- Above zero: Bullish trend
- Below zero: Bearish trend
The blue line acts as a Momentum Indicator, confirming the trend direction and supporting trading decisions.
Volatility-Based Signals
The Squeeze Break uses Bollinger Bands and Keltner Channels to detect volatility squeezes:
- Red histogram: Bollinger Bands inside the Keltner Channel → low volatility, trend absent
- Green histogram: Bollinger Bands break outside the Keltner Channel → high volatility, trend beginning
The distance between Bollinger Bands and Keltner Channel determines the histogram bar height, signaling Trend Strength.
How to Trade with the Squeeze Break Indicator
Bullish Setup
- Observe the histogram turn green.
- Confirm the blue oscillator line is above zero.
- Enter a BUY position at the start of the bullish trend.
- Hold the position until the histogram shortens or returns red, signaling a potential trend pause.
Bearish Setup
- Observe the histogram turn green.
- Confirm the blue oscillator line is below zero.
- Enter a SELL position at the start of the bearish trend.
- Exit when the histogram shortens or returns red.
This approach allows traders to enter at the optimal point of trend initiation and avoid consolidating market phases.
Benefits of Using the Squeeze Break Indicator
- Detects trend beginnings and continuations
- Measures trend strength using histogram bar length
- Confirms trend direction via the blue oscillator line
- Applicable to Forex, stocks, and other markets
- Supports volatility-based trading strategies inspired by John Carter
Conclusion
The Squeeze Break Indicator for MT5 is a powerful volatility and trend detection tool that combines Bollinger Bands, Keltner Channels, and momentum analysis. Its histogram and oscillator line clearly indicate when a trend is starting, its strength, and direction, making it easier to enter and exit trades at optimal points.
FAQ
Published:
Mar 07, 2026 10:49 AM
Category: