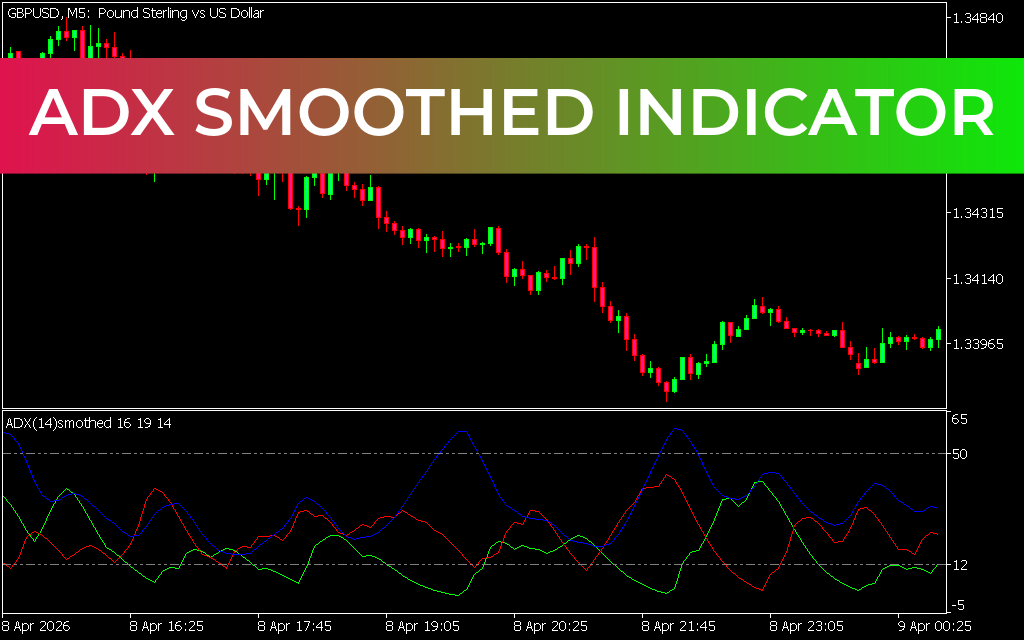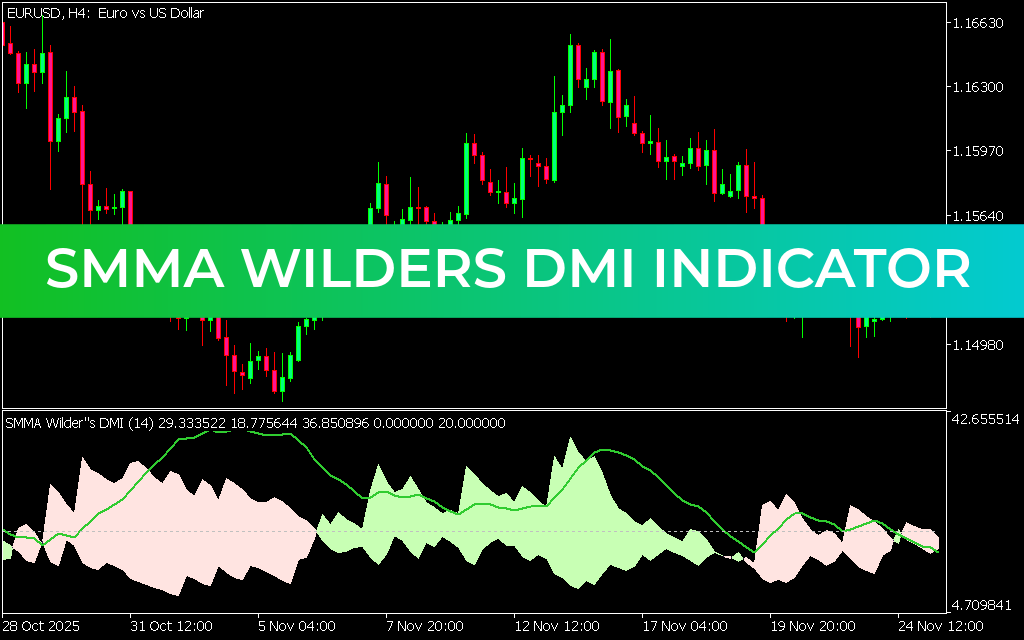
The SMMA Wilders DMI Indicator for MT5 is a powerful technical analysis tool designed to measure both the strength and direction of a market trend. It combines the Directional Movement Index (DMI) with ADX and ADXR components to help traders identify strong trading opportunities in trending markets.
This indicator is widely used by both beginners and professional traders because it clearly shows whether buyers or sellers are in control of Price Action.
What Is the SMMA Wilders DMI Indicator?
The indicator is based on three key components:
- +DI (Plus Directional Indicator): Measures bullish momentum
- -DI (Minus Directional Indicator): Measures bearish momentum
- ADX (Average Directional Index): Measures Trend Strength
Additionally, it includes ADX and ADXR lines, which help confirm whether a trend is strong enough to trade.
Key Features of SMMA Wilders DMI Indicator
- Measures both trend direction and strength
- Displays +DI and -DI lines for momentum comparison
- Includes ADX for trend strength confirmation
- Works across all forex pairs and timeframes
- Suitable for Scalping, intraday, and swing trading
- Helps filter weak or sideways markets
How the SMMA Wilders DMI Indicator Works
The indicator evaluates market conditions using directional movement:
- When +DI is above -DI, bullish momentum is dominant
- When -DI is above +DI, bearish momentum is dominant
- ADX shows whether the trend is strong or weak
A key reference level is:
- ADX above 20 → strong trend condition
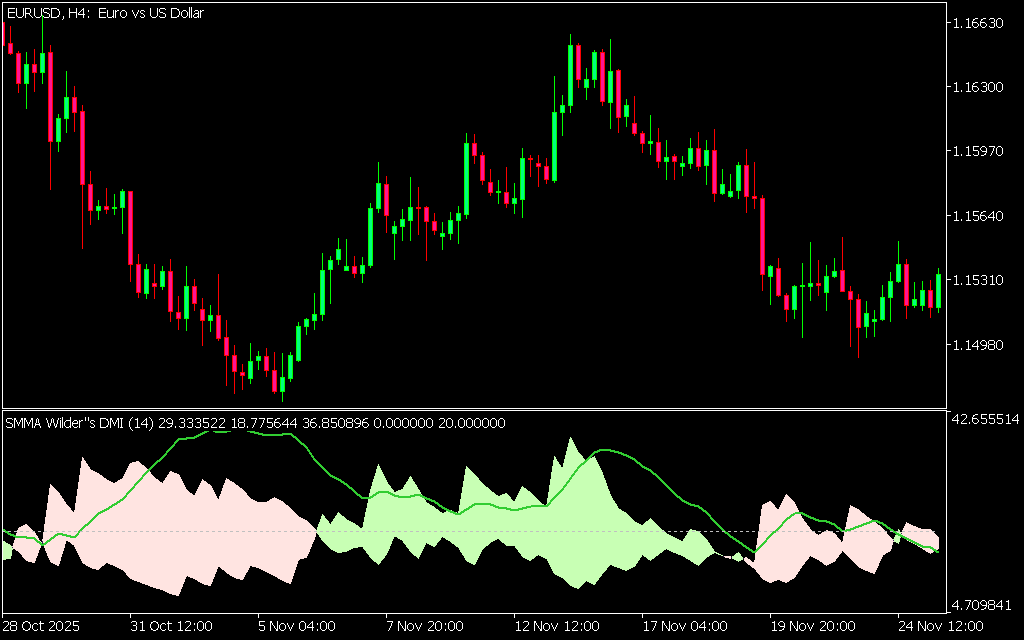
BUY and SELL Signals
Buy Signal
A BUY setup occurs when:
- +DI crosses above -DI
- The indicator zone turns light green
- ADX is above 20, confirming strong momentum
- The green zone expands, showing increasing bullish strength
Entry: Enter long positions after confirmation
Stop Loss: Below recent swing low
Exit: When DI lines cross again or trend weakens
Sell Signal
A SELL setup occurs when:
- -DI crosses above +DI
- The indicator zone turns pink/red
- ADX is above 20, confirming strong bearish momentum
- The red zone expands, showing strong selling pressure
Entry: Enter short positions after confirmation
Stop Loss: Above recent swing high
Exit: When DI lines cross back or trend loses strength
How to Trade SMMA Wilders DMI Effectively
To improve accuracy:
- Trade only when ADX is above 20
- Avoid weak or sideways markets
- Confirm signals with price action (candlestick patterns)
- Use higher timeframes for stronger signals
- Exit trades when +DI and -DI cross again
Best Timeframes
The indicator works on all timeframes but performs best on:
- M30 and H1 for intraday trading
- H4 for swing trading
- Daily charts for long-term trends
Recommended Indicator Combinations
For stronger confirmation, combine SMMA Wilders DMI with:
- Moving Averages (trend direction)
- RSI (momentum confirmation)
- Support & Resistance zones
- Price action patterns
Conclusion
The SMMA Wilders DMI Indicator for MT5 is a reliable trend strength tool that helps traders identify when the market is trending strongly and in which direction. By combining directional movement (+DI/-DI) with ADX strength confirmation, it provides clear buy and sell signals.
When used with proper risk management and additional confirmation tools, it can significantly improve trading accuracy and decision-making.
3 Downloads
Published:
Apr 13, 2026 08:37 AM
Category: