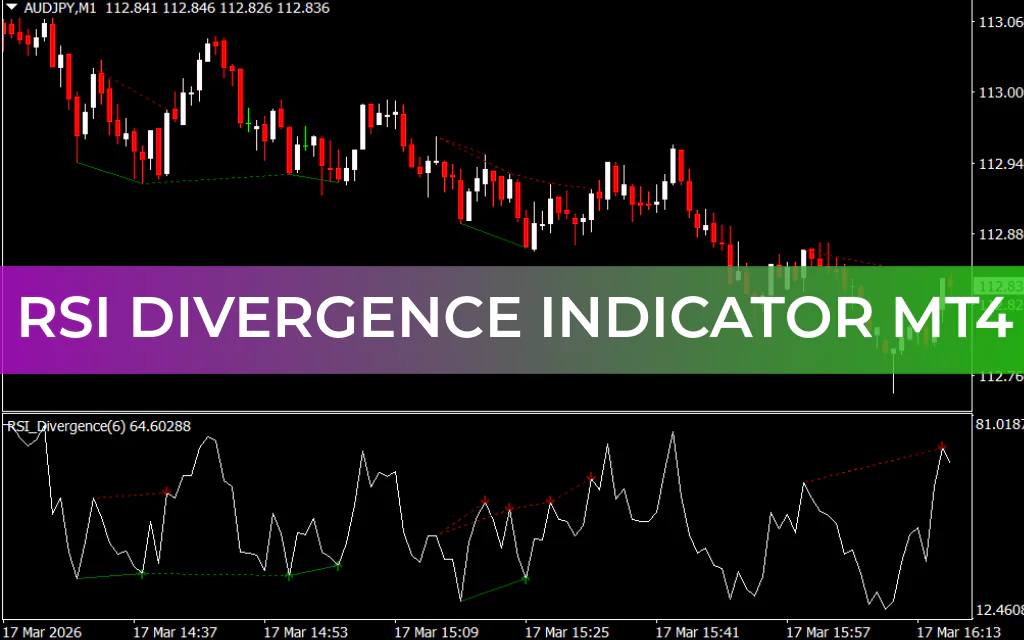
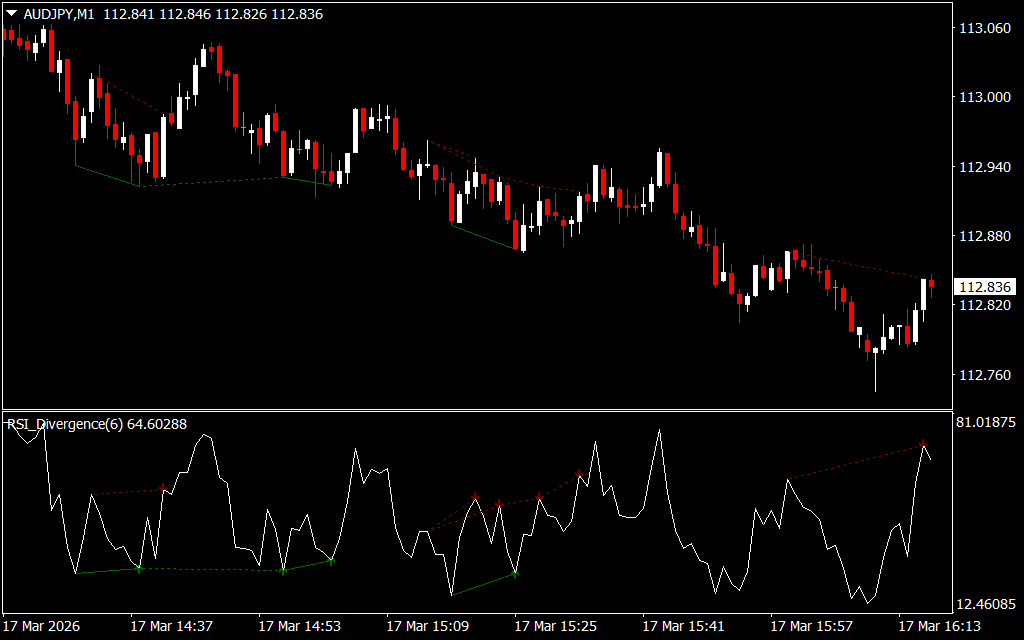
The RSI Divergence Indicator is a powerful tool for forex traders that identifies when Price Action and momentum indicators are no longer aligned. It combines the Relative Strength Index (RSI) with divergence analysis to highlight potential trend reversals before they happen.
How RSI Divergence Works
The RSI is a momentum oscillator that measures the speed and change of price movements:
- Scale: 0 to 100
- Oversold: Below 30 (potential buy opportunity)
- Overbought: Above 70 (potential sell opportunity)
A divergence occurs when price and RSI move in opposite directions:
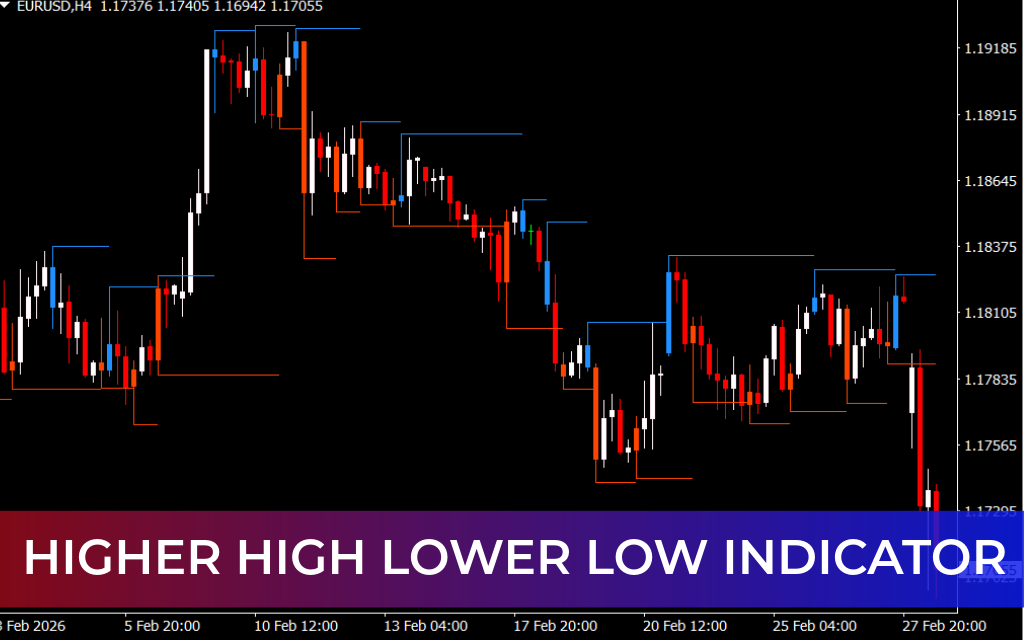
- Bullish Divergence: Price forms lower lows, but RSI forms higher lows. Signals a potential upward reversal.
- Bearish Divergence: Price forms higher highs, but RSI forms lower highs. Signals a potential downward reversal.
Divergences indicate that the current trend is losing momentum, often preceding a price reversal or trend continuation after a pullback.
RSI Divergence Indicator Signals
Buy Signals (Bullish Divergence)
- Look for RSI to be oversold (<30) while the price is forming lower lows.
- Entry: Wait for a confirmation candle or enter when RSI is oversold.
- Stop-loss: Place near the recent swing low.
- Exit: When RSI starts turning downward or divergence disappears.
Sell Signals (Bearish Divergence)
- Look for RSI to be overbought (>70) while the price is forming higher highs.
- Entry: Take a short trade when RSI confirms overbought condition.
- Stop-loss: Near the recent swing high.
- Exit: When RSI begins to climb up or divergence fades.
Advantages of Using the RSI Divergence Indicator
✅ Early Trend Reversal signals – helps enter trades before the crowd.
✅ Reduces false RSI signals – traditional RSI may fail to show overbought/oversold conditions clearly.
✅ Visual alerts – shows bullish and bearish divergences directly on the chart.
✅ Versatile – works for all timeframes, from intraday to daily charts.
✅ Beginner-friendly – easy to interpret without memorizing complex patterns.
Limitations
❌ Divergences are not 100% accurate – should confirm with price action or support/resistance levels.
❌ Less effective in strongly trending markets without pullbacks.
❌ Works best in combination with other indicators like moving averages, candlestick patterns, or volume analysis.
Conclusion
The RSI Divergence Indicator for MT4 enhances the classic RSI by automatically identifying bullish and bearish divergences. This allows forex traders to spot potential reversals early, filter false RSI signals, and improve trade timing. While not a standalone tool, it works best in conjunction with price action confirmation and other technical indicators.RSI Divergence Indicator for MT4 spots bullish and bearish divergences, helping traders identify potential trend reversals early.
FAQ
2 Downloads
Published:
Mar 17, 2026 11:19 AM
Category: