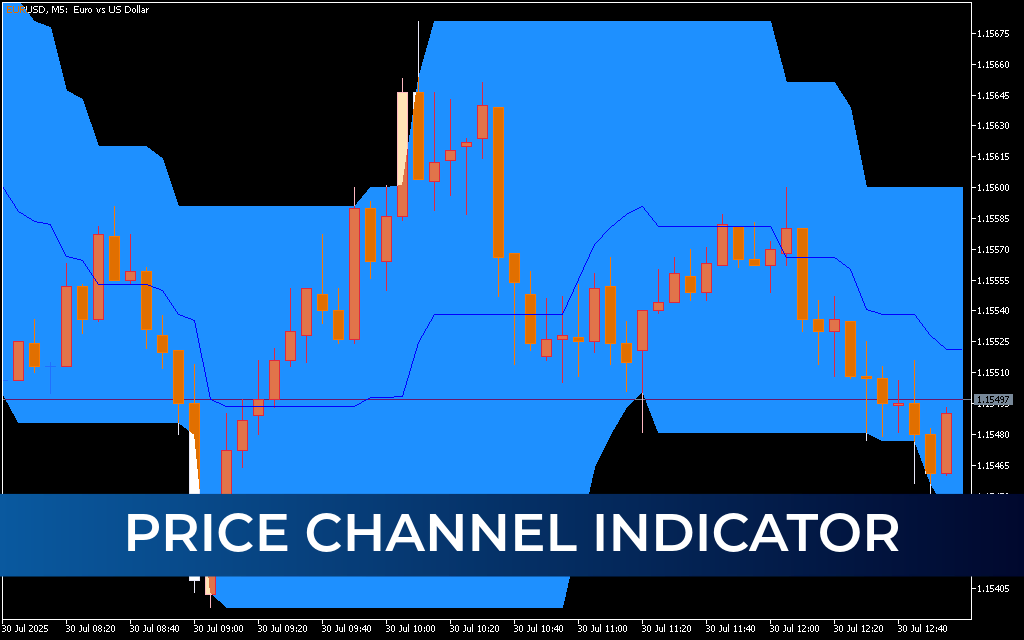
The Price Channel Indicator for MetaTrader 5 (MT5) is a powerful technical analysis tool that builds dynamic price channels using higher timeframe data (H4) and displays them on lower timeframes. This allows traders to gain a broader market perspective while executing more precise entries on shorter charts.
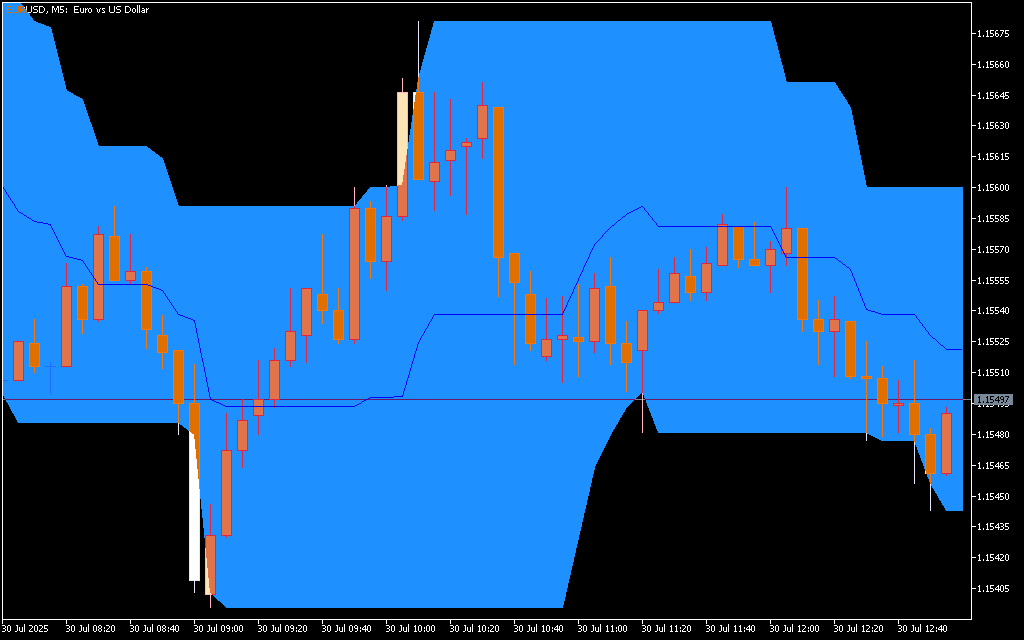
In addition to channel visualization, the indicator includes a histogram based on trading activity and highlights key support and resistance levels, making it highly effective for intraday and short-term trading.
How the Price Channel Indicator Works
The indicator combines Price Action and market activity to create a structured trading environment:
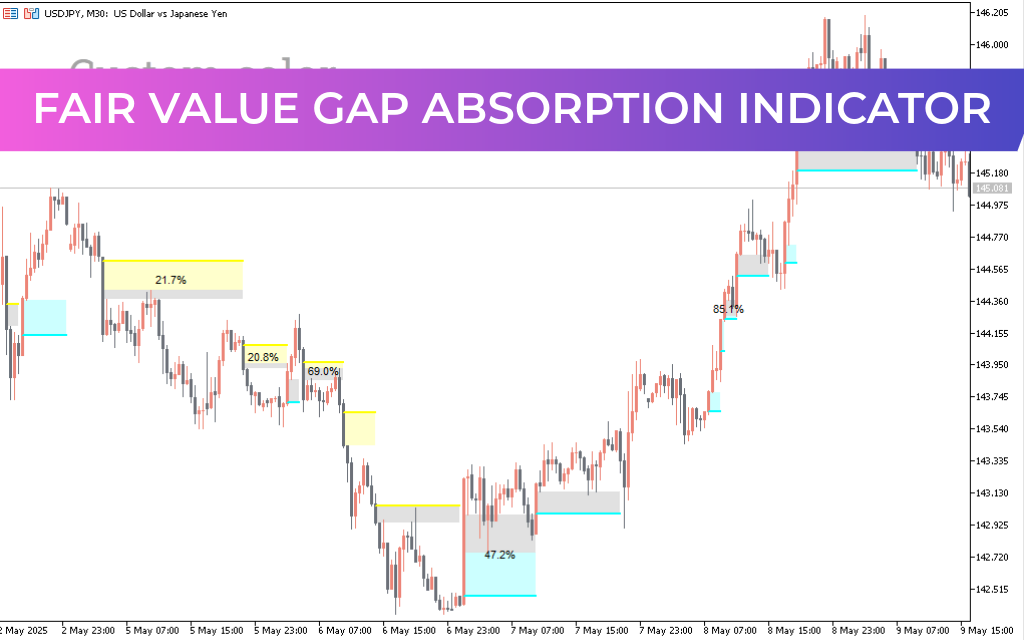
- Channel Zones (Light Blue & Gray): Represent price boundaries
- Blue Line: Acts as a key trend reference and resistance/support level
- Histogram: Reflects trading activity and market participation
- Dotted Areas: Highlight zones where most trades occur
Key Zones:
- 60% Zone: Moderate trading activity
- 90% Zone: High-probability price interaction area
Trading Signals Explained
🔹 Bullish Signal (BUY)
- Price moves above the blue line
- Indicates bullish momentum
- Look for reversal from lower channel zones before entering
Entry Strategy:
- Enter buy when price breaks upward after a pullback
- Place stop-loss below the previous swing low
- Exit at resistance or opposite signal
🔹 Bearish Signal (SELL)
- Price moves below the blue line
- Indicates bearish momentum
- Look for reversal from upper channel zones
Entry Strategy:
- Enter sell when price breaks downward after reversal
- Place stop-loss above recent swing high
- Exit at support or opposite signal
Trading Strategy Tips
- Wait for price to reach extreme channel zones before entering
- Confirm entries with break of key levels (e.g., red line)
- Use histogram activity to validate market strength
- Focus on reversals from high-probability zones (90% area)
Key Features
- Multi-timeframe channel (H4 data on lower charts)
- Built-in support and resistance levels
- Histogram showing trading activity
- High-probability trading zones (60% & 90%)
- Works on all timeframes below H4
- Ideal for intraday and short-term trading
Best Usage Tips
- Combine with price action and candlestick patterns
- Use alongside indicators like RSI or moving averages
- Avoid trading in low volatility conditions
- Apply proper risk management strategies
- Test the indicator on a demo account before live use
Who Should Use This Indicator?
- Day Traders – for precise intraday entries
- Scalpers – for short-term price movements
- Swing Traders – for channel-based setups
- Beginner Traders – due to its visual simplicity
Conclusion
The Price Channel Indicator for MT5 is a highly effective tool for identifying Market Structure, support/resistance levels, and high-probability trading zones. By combining higher timeframe data with lower timeframe execution, it gives traders a strategic advantage in timing entries and exits.
Its simplicity, combined with powerful insights into market activity, makes it a valuable addition to any trading system.
FAQ
2 Downloads
Published:
Mar 24, 2026 09:46 AM
Category: