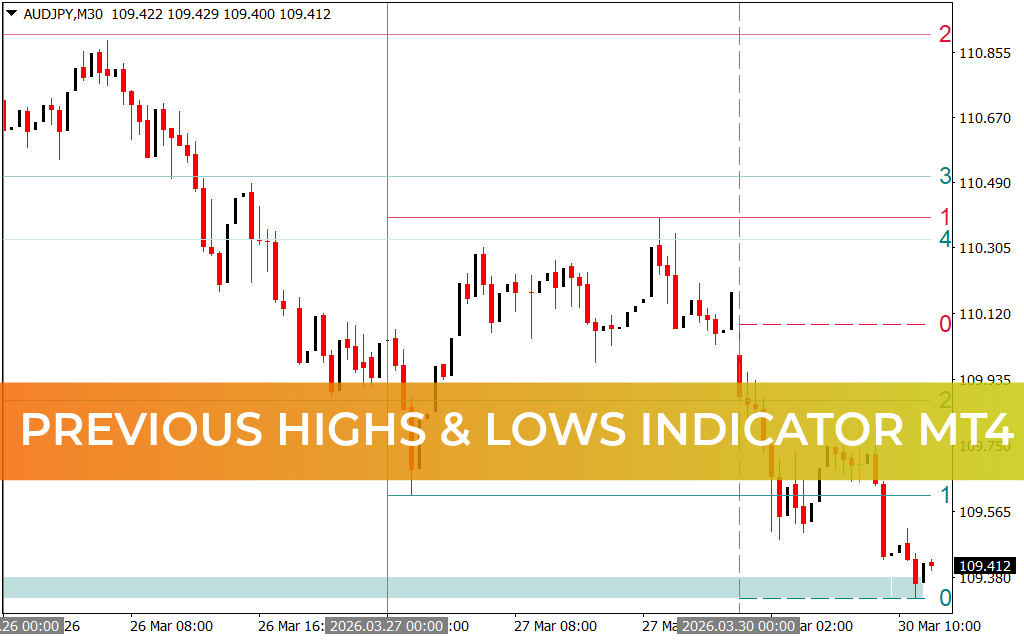
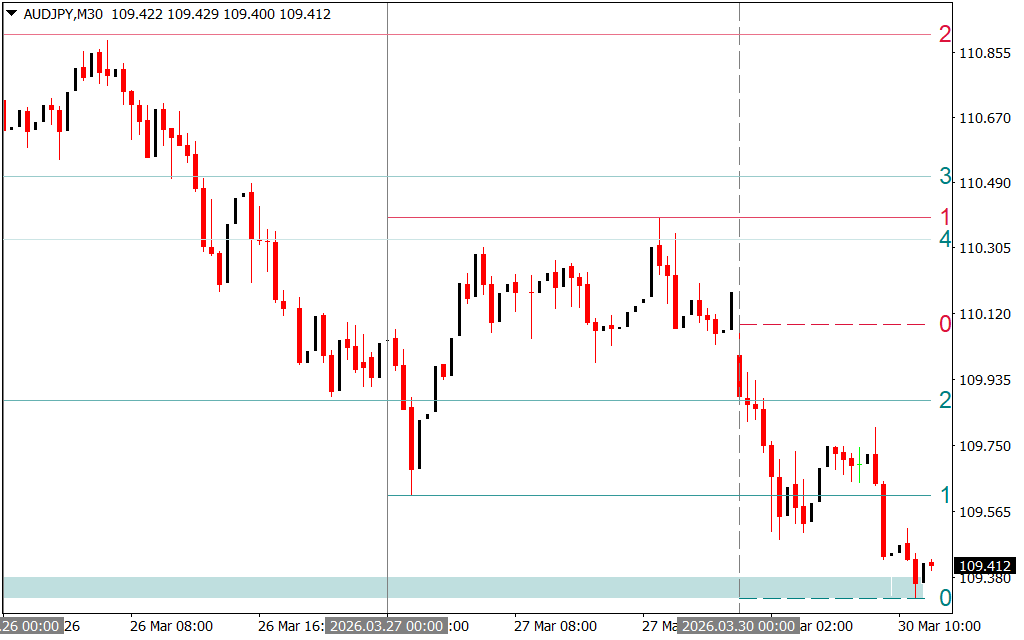
The Previous Highs & Lows Indicator for MT4 is a lightweight yet highly effective trading tool that automatically plots historical high and low price levels directly onto your chart. These levels act as critical decision zones where price often reacts, making them essential for traders using breakout, pullback, and mean-reversion strategies.
Developed as part of the toolkit from LuxAlgo, this indicator focuses on clarity and efficiency—helping traders analyze Market Structure without cluttering their charts.
What Is the Previous Highs & Lows Indicator?
This indicator highlights past price extremes—previous highs and lows—which naturally serve as Support And Resistance levels. These zones are widely watched by traders and institutions, making them powerful areas for potential reversals, breakouts, or trend continuations.
By automating this process, the indicator saves time and removes the need for manual level drawing.
Key Features
- Automatic High & Low Plotting
Instantly displays previous key price levels on your chart. - Clean and Minimal Design
Keeps charts uncluttered for better focus and decision-making. - Dynamic Support and Resistance Zones
Identifies areas where price is likely to react. - Faster Market Analysis
Eliminates manual identification of historical levels. - Multi-Strategy Compatibility
Works with breakout, pullback, and trend-following systems.
How the Indicator Supports Trading Decisions
While the Previous Highs & Lows Indicator does not generate direct buy or sell signals, it provides a powerful framework for understanding price behavior:
- Resistance at Previous Highs
When price approaches a prior high, it may struggle to break through, creating potential short opportunities. - Breakout and Retest
If price breaks above a previous high and retests it as support, it often signals bullish continuation. - Support at Previous Lows
Previous lows act as strong support zones where buying interest may emerge. - Stop-Loss and Take-Profit Placement
These levels provide logical areas for managing risk and locking in profits. - Trend Re-Entry Points
Traders can use these zones to rejoin trends after pullbacks.
Why Use This Indicator?
- Enhances market structure understanding
- Improves timing of entries and exits
- Provides objective support and resistance levels
- Saves time with automated level plotting
- Works seamlessly with other technical tools
Best Used With
For maximum effectiveness, combine this indicator with:
- Trend indicators for direction confirmation
- Candlestick patterns for entry timing
- Momentum tools for validation
Final Thoughts
The Previous Highs & Lows Indicator for MT4 is a simple yet powerful addition to any trader’s toolkit. By highlighting key price levels where the market has previously reacted, it helps traders make more informed and confident decisions.
Whether you're planning breakout trades, identifying reversal zones, or refining your risk management, this indicator provides the clarity needed to stay ahead in the market.
FAQ
3 Downloads
Published:
Mar 30, 2026 06:05 AM
Category: