The Polynomial Regression Channel Indicator for MT4 is a powerful technical analysis tool used to identify trend channels and potential reversal zones in the market. Unlike traditional channel indicators that draw straight lines, this indicator uses polynomial regression calculations to create a dynamic channel that adapts smoothly to price movements and market volatility.
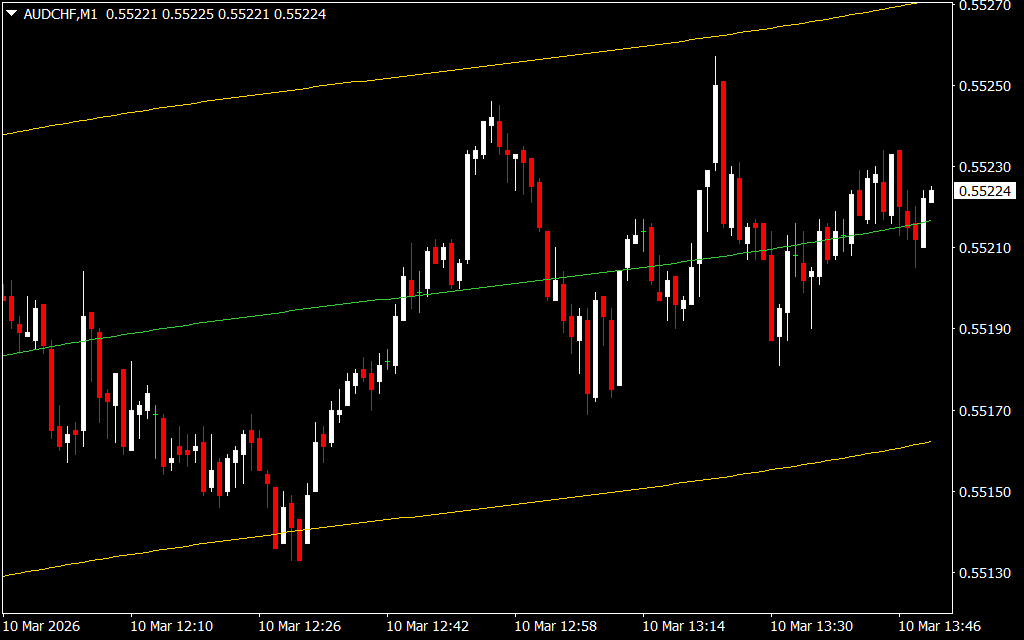
Because the channel curves naturally with the trend, it provides a more accurate representation of market direction. This allows traders to better understand trend bias, identify potential turning points, and trade in alignment with the prevailing market direction.
The indicator displays a three-line channel consisting of an upper band, a middle line, and a lower band. Each of these components plays an important role in analyzing price behavior.
- Upper Band: Represents a potential overbought zone and dynamic resistance level.
- Lower Band: Represents a potential oversold zone and dynamic support level.
- Middle Band: Indicates the overall trend direction and strength.
These channel levels help traders identify buy and sell opportunities, making the indicator useful for both trend-following and counter-trend trading strategies.
The Polynomial Regression Channel indicator is easy to use and works well for traders at all experience levels, including beginners, intermediate traders, and advanced professionals. It can also be applied to different trading styles such as Scalping, intraday trading, and swing trading.
How to Trade With the Polynomial Regression Channel Indicator
When applied to an MT4 chart, the indicator forms a curved channel around the price. Traders can use the relationship between price and the channel bands to identify potential trading opportunities.
For better accuracy, it is recommended to combine the indicator with Price Action analysis or other technical indicators.
Buy Setup
A buy opportunity occurs when the price moves toward the lower band of the channel, indicating a potential oversold condition.
The ideal approach is to:
- Wait for the price to touch or approach the lower band.
- Look for wick rejection or bullish price action.
- Enter a buy trade after a bullish candle forms.
This setup suggests that the price may reverse upward within the channel.
Sell Setup
A sell opportunity appears when the price moves toward the upper band, indicating a potential overbought condition.
Traders can:
- Wait for the price to reach the upper band.
- Look for rejection or bearish price action.
- Enter a sell trade after a bearish candle confirmation.
This setup indicates a possible downward price reaction within the channel.
Trade Management
Traders can manage their positions using the channel structure:
- Stop Loss: Place it slightly beyond the band where the trade was opened.
- Take Profit: Target the opposite band of the channel.
- Trailing Stop: Move the stop loss once the price crosses the middle line in the trade’s direction.
This approach helps traders lock in profits while allowing the trade to follow the trend.
Why Use the Polynomial Regression Channel Indicator
This indicator is valuable because it adapts to changing market conditions and provides insights into both trend continuation and potential reversals. Its dynamic channel structure helps traders identify key price zones where market reactions are likely to occur.
It is especially useful for traders who prefer structured channel trading strategies.
Conclusion
The Polynomial Regression Channel Indicator for MT4 is a versatile and easy-to-use tool for identifying market trends and potential reversal zones. With its adaptive channel design, it provides a clearer view of price movements compared to traditional straight-line channel indicators.
Suitable for both trend and counter-trend traders, this indicator helps identify high-probability trading opportunities across multiple timeframes. Best of all, it is free to d
FAQ
Published:
Mar 10, 2026 08:51 AM
Category: