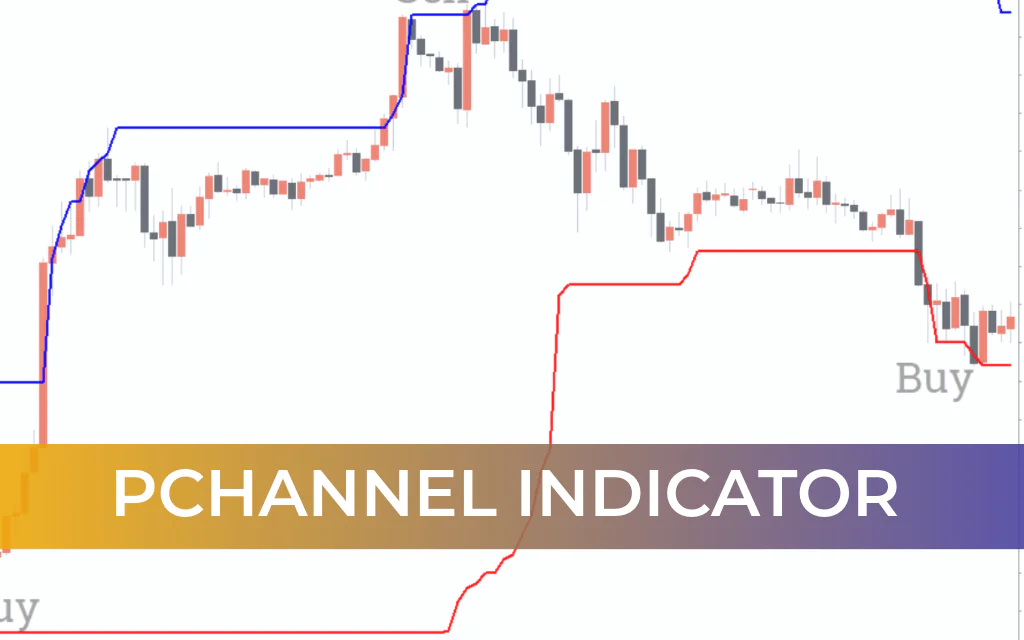
The PChannel Indicator for MT4 (Price Channel Indicator) is a simple yet powerful trading tool based on the highest high and lowest low of a specified number of previous bars.
The indicator automatically plots a dynamic price channel:
Upper Channel Line (Blue) → Highest high
Lower Channel Line (Red) → Lowest low
As Price Action changes, the channel adjusts dynamically, providing traders with clear bullish and bearish trend signals, breakout opportunities, and reversal setups.
The indicator does not repaint, since it is calculated purely from historical price data. It is suitable for both new and advanced forex traders and can be easily integrated into any technical trading strategy.
How the PChannel Indicator Works
The PChannel reflects the Market Structure using recent highs and lows:
Price above the upper channel → Bullish breakout
Price below the lower channel → Bearish breakout
Price inside a flat channel → Ranging market
The channel expands or contracts as new highs or lows are formed.
PChannel Indicator for MT4 – Trading Signals
1. Breakout Strategy
Buy Setup (Bullish Breakout)
Price breaks and sustains above the upper channel (Blue line).
This signals strong bullish momentum.
Enter a BUY position after confirmation.
Stop Loss:
Near or below the lower channel line.
Take Profit:
Based on a favorable risk-reward ratio or next resistance level.
Sell Setup (Bearish Breakout)
Price breaks below the lower channel (Red line).
This indicates bearish momentum.
Enter a SELL trade.
Stop Loss:
Near or above the upper channel line.
Take Profit:
Based on risk-reward ratio or next support zone.
2. Reversal Strategy (Channel Failure)
If price fails to break out and shows rejection at channel boundaries:
The channel acts as dynamic Support And Resistance.
Enter trades in the opposite direction of the failed breakout.
Reversal Confirmation Tips
Look for rejection candles (pin bars, engulfing patterns).
Confirm near established support or resistance zones.
Monitor trading volume for added strength.
Reversal setups are stronger when aligned with broader market structure.
Trend Identification
The PChannel Indicator also helps determine overall market conditions:
Flat channel → Ranging market
Price above upper channel → Bullish trend
Price below lower channel → Bearish trend
This makes it a versatile tool for both breakout and trend-following strategies.
Multi-Timeframe (MTF) Strategy
The indicator works effectively across:
Intraday charts (M15, M30, H1)
Daily charts
Weekly charts
Monthly charts
Using a multi-timeframe approach:
Identify trend direction on a higher timeframe.
Use a lower timeframe to pinpoint entry opportunities.
This improves precision and reduces false signals.
Advantages of the PChannel Indicator
Simple highest-high / lowest-low calculation
Dynamic price-based channel
Non-repainting structure
Effective for breakout and reversal trading
Suitable for beginners and professionals
Works on all timeframes
Important Trading Tip
For best results, combine the PChannel Indicator with:
Price action confirmation
Support and resistance analysis
Trendlines
Volume indicators
Confluence significantly increases trade reliability.
Conclusion
The PChannel Indicator for MT4 is a straightforward and effective price channel tool that relies solely on the highest high and lowest low of previous bars. Because it is purely price-based and non-repainting, it provides reliable breakout and reversal signals.
Its simplicity makes it beginner-friendly, while its flexibility allows advanced traders to integrate it into structured trading systems.
The indicator is free to download, easy to install, and highly adaptable across different market conditions.
FAQ
2 Downloads
Published:
Feb 20, 2026 07:08 AM
Category: