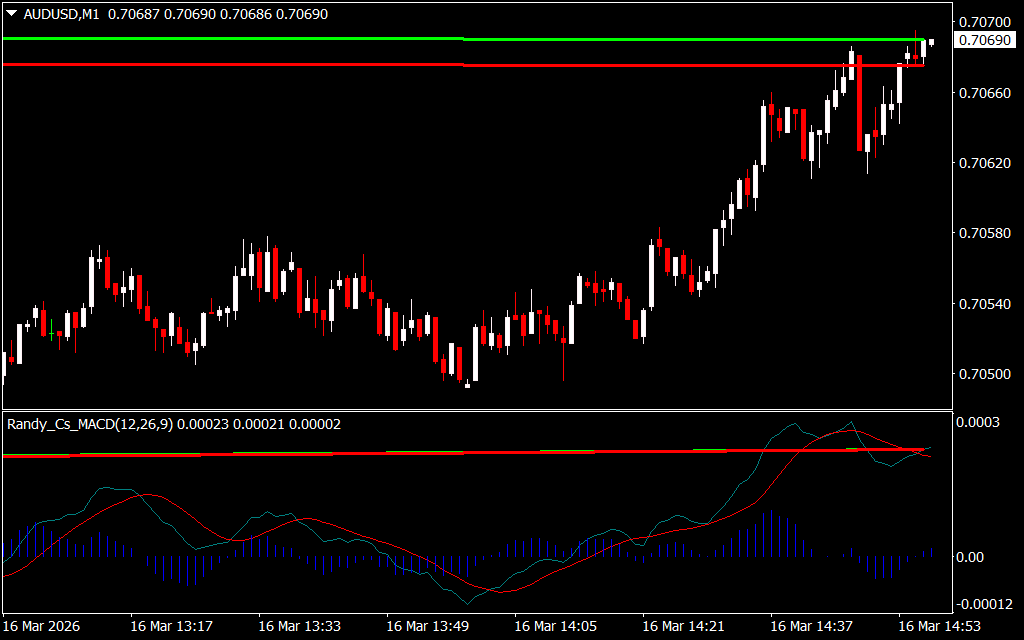
The MACD Divergence Indicator for MT4 is a powerful tool that helps traders detect divergence between price movement and the MACD oscillator. Divergence is one of the most reliable techniques in technical analysis for identifying potential trend reversals or trend continuations before they become obvious on the chart.
This indicator automatically highlights divergence signals, making it easier for traders to identify high-probability trading opportunities without manually drawing trendlines.
Key Components of the MACD Divergence Indicator
The indicator uses the core elements of the MACD (Moving Average Convergence Divergence):
1. MACD Histogram
- Shows the strength and direction of the trend.
- Increasing histogram bars indicate strengthening momentum.
2. 12 EMA (Fast EMA)
- Reacts quickly to price changes.
- Used to identify early trend shifts.
3. 25 EMA (Slow EMA)
- Provides a smoother trend signal.
- When crossed by the fast EMA, it confirms trend direction.
Types of Divergence
The MACD Divergence Indicator detects two main types of divergence:
1. Regular Divergence (Trend Reversal Signal)
Regular divergence usually signals that the current trend may reverse.
Bullish Regular Divergence
- Price makes lower lows
- MACD makes higher lows
- Indicates potential bullish reversal
Bearish Regular Divergence
- Price makes higher highs
- MACD makes lower highs
- Indicates potential bearish reversal
2. Hidden Divergence (Trend Continuation Signal)
Hidden divergence indicates that the existing trend is likely to continue.
Bullish Hidden Divergence
- Price makes higher lows
- MACD makes lower lows
- Signals uptrend continuation
Bearish Hidden Divergence
- Price makes lower highs
- MACD makes higher highs
- Signals downtrend continuation
How to Trade Using the MACD Divergence Indicator
Buy Trade Setup (Bullish Divergence) 🟢
- Identify bullish regular or hidden divergence.
- Look for confirmation with a bullish candle pattern (e.g., engulfing candle).
- Wait for the 12 EMA to cross above the 25 EMA.
- Enter a BUY trade.
Stop Loss:
Place below the recent swing low.
Take Profit:
- At key resistance levels
- Or when the 12 EMA crosses back below the 25 EMA
Sell Trade Setup (Bearish Divergence) 🔴
- Identify bearish regular or hidden divergence.
- Confirm with a bearish candle pattern (e.g., doji or engulfing).
- Wait for the 12 EMA to cross below the 25 EMA.
- Enter a SELL trade.
Stop Loss:
Place above the recent swing high.
Take Profit:
- At support levels
- Or when the 12 EMA crosses above the 25 EMA
Best Timeframes for Divergence Trading
For more reliable signals, traders typically use:
- H1 (1 Hour)
- H4 (4 Hour)
- Daily charts
Higher timeframes reduce noise and improve the accuracy of divergence signals.
Pros and Cons
✅ Pros
- Identifies trend reversals early
- Detects hidden divergence for trend continuation
- Helps find high reward-to-risk trades
- Works well with Price Action confirmation
❌ Cons
- Divergence signals may appear too early
- Requires confirmation before entry
- Less reliable on very small timeframes
Conclusion
The MACD Divergence Indicator for MT4 is one of the most effective tools for identifying hidden market momentum changes. By spotting divergence between price and the MACD oscillator, traders can anticipate trend reversals and continuation setups before the market fully reacts.
When combined with EMA crossovers, candlestick patterns, and support/resistance levels, this indicator can significantly improve the accuracy of trading decisions.
For best results, use it on H1, H4, or Daily charts, where divergence signals tend to be more reliable.
FAQ
Published:
Mar 16, 2026 09:58 AM
Category: