The Color OSMA Indicator for MT4 is a simple yet powerful technical tool designed to help traders identify market trend direction and momentum shifts. Based on the oscillator of a moving average (OSMA), this indicator uses colored histograms to visually highlight bullish and bearish pressure in the market.
It works on any instrument, currency pair, and timeframe, making it a versatile tool for scalpers, intraday, and swing traders.
What is the Color OSMA Indicator?
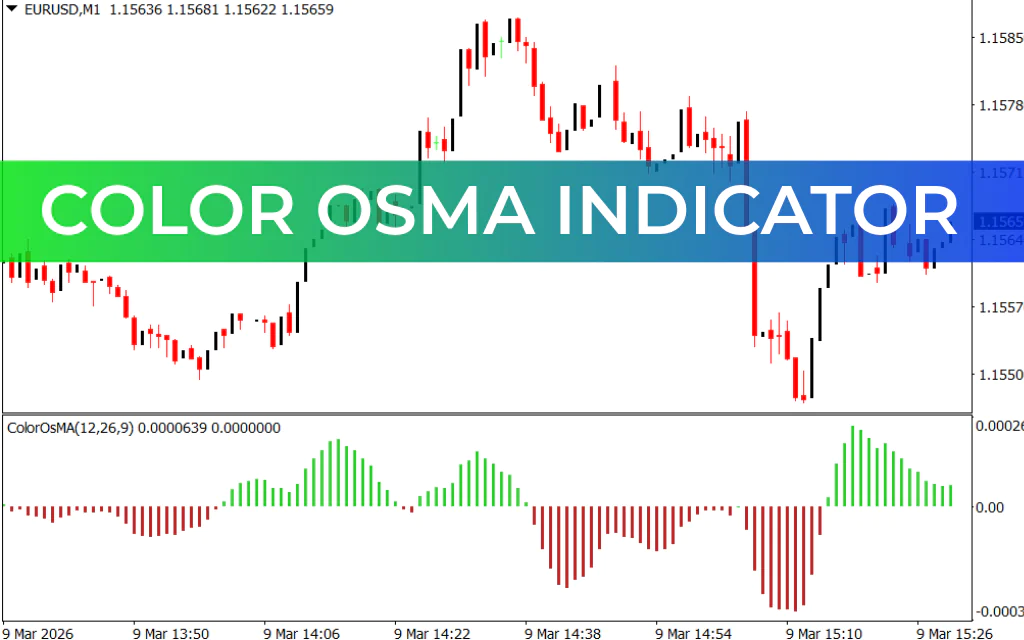
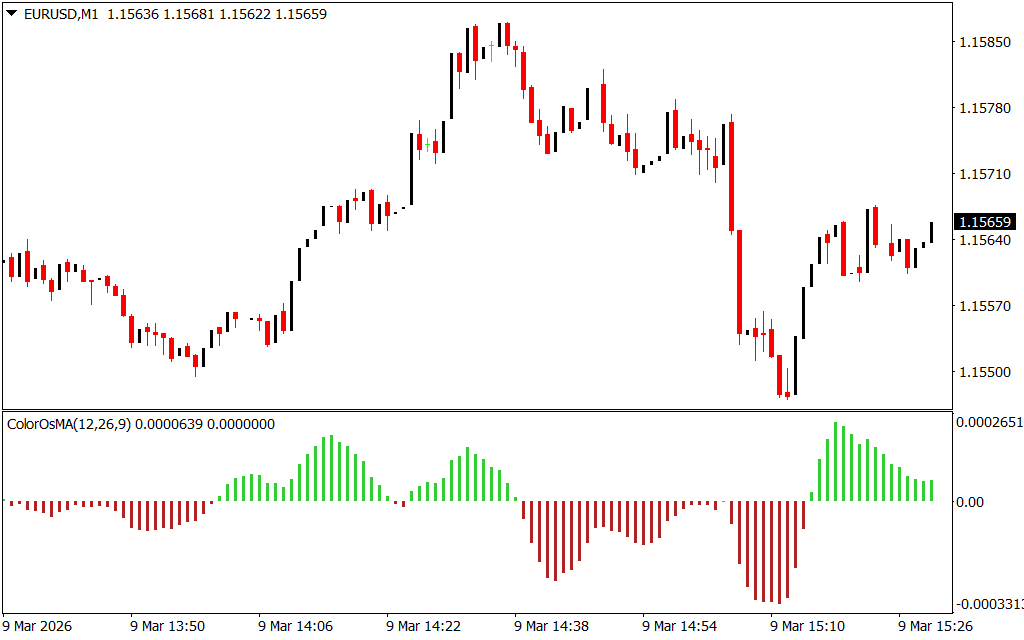
The Color OSMA is a histogram-based oscillator similar to MACD, plotted in a separate window below the price chart. Each bar represents the momentum of the market, and the color coding makes it easy to interpret:
- Green Bars Above Zero Line → Bullish momentum, potential buy signals
- Brown/Firebrick Bars Below Zero Line → Bearish momentum, potential sell signals
By monitoring the bar position relative to the zero line and the color of the bars, traders can quickly gauge market sentiment and Trend Strength.
How the Indicator Works
The Color OSMA displays oscillator histograms that indicate the market's momentum:
- Buy Signal – When green bars appear above the zero line, bullish momentum is increasing. Longer bars indicate stronger upward momentum.
- Sell Signal – When brownish bars appear below the zero line, bearish pressure is increasing. Longer bars indicate stronger downward momentum.
This approach allows traders to enter trades in the direction of the dominant momentum and exit when the bars shorten, signaling a weakening trend.
Trading Example
Consider the EUR/USD weekly chart:
- The indicator posts green bars, signaling rising bullish momentum. A trader might open a long position.
- As the bars start shortening, momentum is waning, suggesting caution or exit.
- When brownish bars appear below the zero line, the bearish trend is gaining strength, and a short position may be appropriate.
By following the color and length of the histogram bars, traders can ride trends and anticipate reversals with greater confidence.
Advantages of the Color OSMA Indicator
- Simple histogram-based visual signals
- Works on any timeframe and trading instrument
- Helps identify trend direction and momentum changes
- Suitable for novice, intermediate, and advanced traders
- Can be combined with Price Action or other indicators for higher accuracy
This makes the Color OSMA a user-friendly yet powerful tool for momentum-based trading strategies.
Conclusion
The Color OSMA Indicator for MT4 is an effective tool for analyzing market trends and momentum shifts. Its colored histogram allows traders to quickly identify bullish and bearish pressure, improving the timing of entry and exit decisions.
With its flexibility across timeframes and instruments, it is a must-have for traders looking to enhance their trend-following and momentum strategies.
Download Color OSMA Indicator for MT4 for Free Now!
FAQ
5 Downloads
Published:
Mar 09, 2026 10:33 AM
Category: