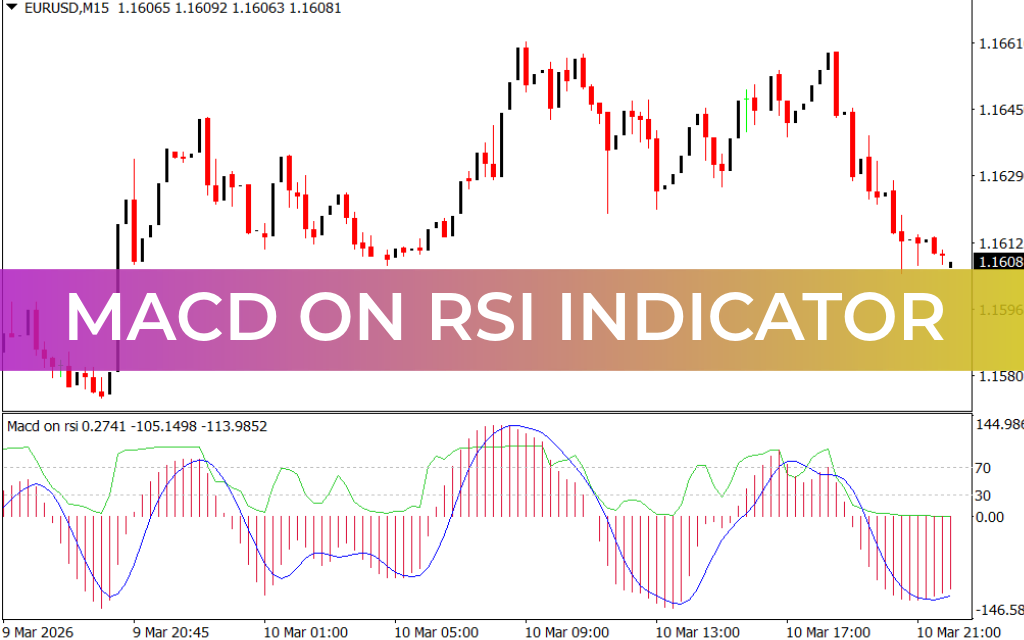
The MACD on RSI Indicator is a momentum-based MT4 tool that combines two of the most widely used technical indicators in forex: MACD (Moving Average Convergence Divergence) and RSI (Relative Strength Index). It helps traders identify trend direction, overbought/oversold conditions, and optimal entry/exit points.

Key Features
- Combination of Indicators – Integrates MACD and RSI for enhanced trend and momentum detection.
- Three Moving Averages:
- Fast EMA (Green Line) – responds quickly to price changes.
- Slow EMA (Blue Line) – slower, smoother Trend Confirmation.
- Signal SMA – for crossover confirmation.
- General 5-Period MA – adds trend context.
- Histogram – plots bars directly on the chart to reflect momentum, unlike traditional MACD which is displayed below the chart.
- RSI Component – identifies overbought (≥70) and oversold (≤30) conditions.
- Timeframe Flexibility – works on all timeframes but gives the most reliable signals on longer-term charts like H4 and above.
How to Trade With MACD on RSI Indicator
Buy Signal
- Ensure the bars are in oversold territory (RSI ≤ 30).
- Confirm that fast EMA is below slow EMA.
- Wait for Price Action confirmation, e.g., a bullish candlestick pattern or upward momentum.
- Open a BUY/LONG position.
⚠️ Note: In choppy or ranging markets, the indicator may give signals that fail. Always wait for price action confirmation.
Sell Signal
- Ensure the bars are in overbought territory (RSI ≥ 70).
- Confirm that fast EMA is above slow EMA.
- Wait for price action confirmation, e.g., a bearish candlestick pattern or downward momentum.
- Open a SELL/SHORT position.
Advantages
- Combines trend-following (MACD) with momentum/reversal (RSI) analysis.
- Provides clear entry and exit points.
- Helps filter false signals in trending markets.
- Suitable for novice and advanced traders.
Conclusion
The MACD on RSI Indicator for MT4 is a powerful momentum and trend-following tool. By combining MACD crossovers and RSI overbought/oversold levels, it gives traders a clear visual of potential buy and sell opportunities. It is versatile, works across multiple timeframes, and is free to download.
FAQ
Published:
Mar 10, 2026 17:21 PM
Category: