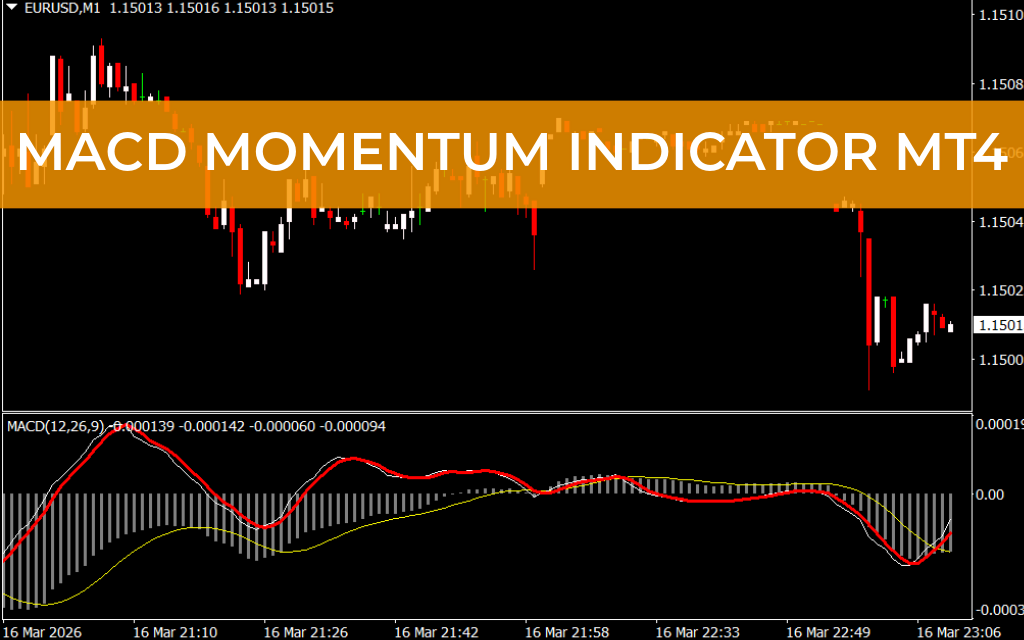
The MACD Momentum Indicator for MetaTrader 4 (MT4) is a powerful technical tool that monitors the difference between simple and exponential moving averages to measure market momentum. It helps traders identify bullish and bearish momentum shifts with clear visual signals.
This indicator uses the MACD histogram bars to display the difference between moving averages. When the histogram values are positive, it indicates bullish momentum. When the values turn negative, it signals bearish momentum. This straightforward visualization makes it easy for traders to understand market strength and potential trend changes.
Because of its simplicity and effectiveness, the MACD Momentum Indicator is widely used by both beginner and professional traders. Its clear signals, simple trading rules, and easy interpretation have made it one of the most popular indicators available for the MT4 platform.
Market analysts consider the MACD Momentum Indicator highly suitable for forex Scalping, intraday trading, swing trading, and long-term trend analysis.
How the MACD Momentum MT4 Indicator Works
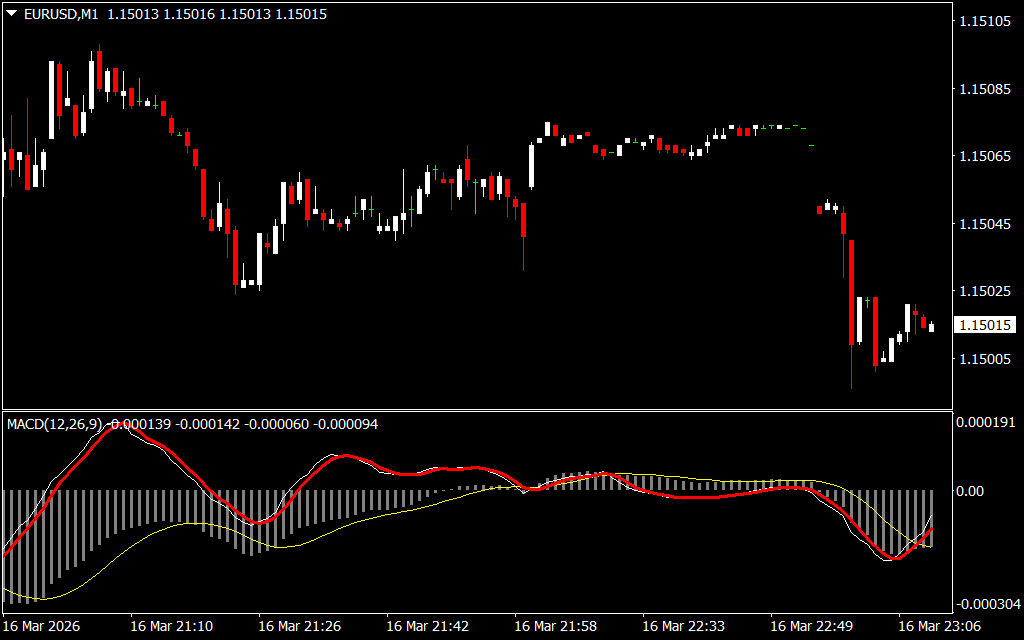
The indicator combines several moving averages to detect momentum changes in the market:
- Red Line: 9-period Signal Simple Moving Average (SMA)
- Green Line: 12-period Exponential Moving Average (EMA)
- Yellow Line: 26-period Exponential Moving Average (EMA)
The histogram bars represent the difference between these moving averages and provide quick momentum signals for traders.
How to Trade with the MACD Momentum Indicator
Bullish Trading Setup
A bullish signal occurs when the market begins to gain upward momentum.
Key conditions for a buy signal:
- The MACD histogram bars turn positive.
- The fast EMA (12) crosses above the signal SMA (9).
- The slow EMA (26) remains below the other moving averages for additional confirmation.
Once these conditions appear, traders may open a buy position. The bullish trend often continues as long as the histogram bars stay in the positive zone.
Exit Strategy:
If the histogram bars turn negative, it signals weakening bullish momentum. Traders should consider closing their buy positions at that point.
Bearish Trading Setup
A bearish signal indicates downward momentum in the market.
Conditions for a sell signal:
- The fast EMA (12) crosses below the signal SMA (9).
- The fast EMA moves below the slow EMA (26).
- The MACD histogram bars turn negative.
When these conditions occur, traders can open a sell position to take advantage of the downward trend.
Exit Strategy:
Close the sell trade when the histogram bars move back into the positive zone, indicating a potential bullish momentum shift.
Advantages of the MACD Momentum Indicator
The MACD Momentum Indicator offers several benefits for traders:
- Clear and easy-to-read histogram signals
- Works on all MT4 timeframes
- Suitable for scalping, intraday, and swing trading
- Helps confirm trend direction and momentum strength
- Compatible with most forex trading strategies
Additionally, this indicator can be used across multiple financial markets, including forex, stocks, cryptocurrencies, CFDs, and commodities.
Conclusion
The MACD Momentum Indicator for MT4 is one of the most reliable momentum tools available for traders. By analyzing the relationship between moving averages and displaying the results through histogram bars, it provides clear buy and sell signals.
Whether you are a beginner or an experienced trader, this indicator can help improve trading accuracy, identify trend momentum, and enhance overall trading performance. Integrating the MACD Momentum Indicator into your existing trading strategy can significantly increase your ability to spot profitable market opportunities.
FAQ
Published:
Mar 16, 2026 18:12 PM
Category: