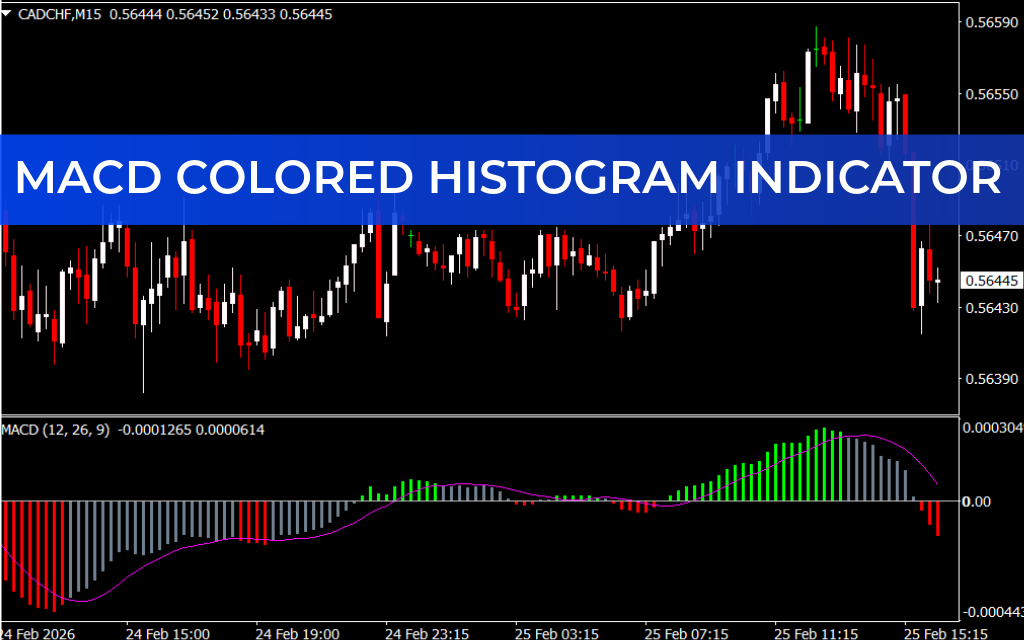
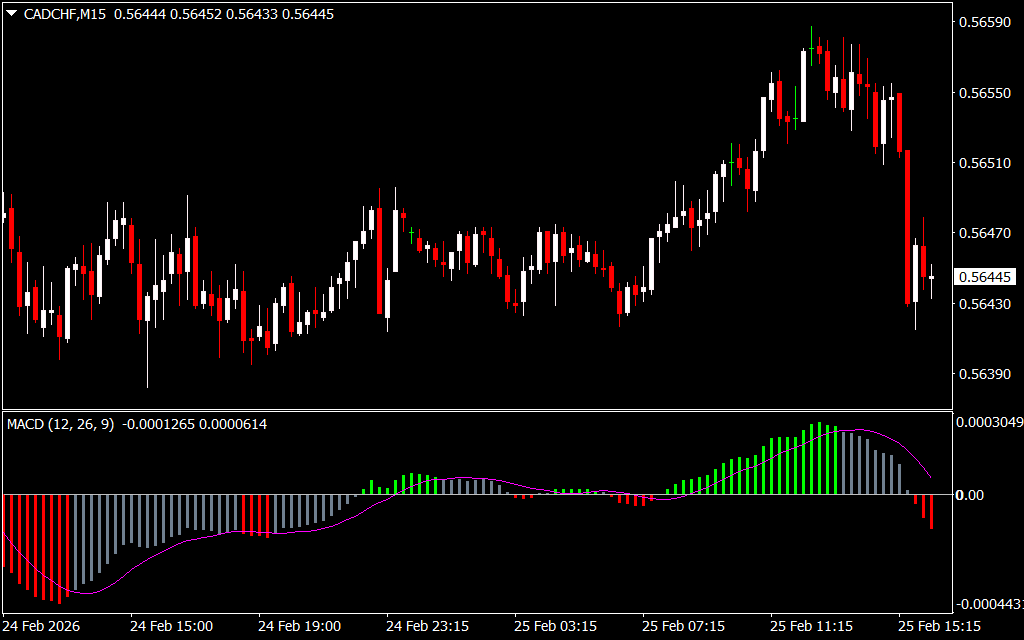
The MACD Colored Histogram Indicator for MT4 is an advanced version of the classic MACD, offering clearer visual cues for Trend Strength and momentum shifts. By color-coding the histogram bars, this indicator makes it easier for traders to distinguish bullish and bearish trends, improving decision-making for entries and exits.
Key Features of the MACD Colored Histogram Indicator
- Color-Coded Histogram Bars: Green for bullish momentum, red for bearish momentum, gray for weakening trends.
- Comprehensive Market Analysis: Combines histogram, signal line, and fast/slow EMAs for Trend Confirmation.
- Multi-Time Frame Support: Suitable for all trading strategies and time frames.
- Beginner-Friendly and Advanced: Clear visual signals make it accessible to all traders.
How the MACD Colored Histogram Indicator Supports Trading
The MACD Colored Histogram Indicator provides actionable insights for momentum-based trading:
- Buy Signals: Green bars above the zero line indicate strong bullish momentum, suggesting long positions.
- Sell Signals: Red bars below the zero line indicate increasing bearish momentum, signaling potential short trades.
- Trend Weakening: Gray bars signal a slowdown in momentum, helping traders anticipate possible reversals or consolidations.
By using these color-coded cues, traders can better time their trades, manage risk, and optimize entries and exits according to market momentum.
Why Traders Choose the MACD Colored Histogram Indicator
For traders seeking a clearer way to interpret MACD signals, the MACD Colored Histogram Indicator for MT4 enhances traditional MACD functionality with color-coded visualizations. Its combination of precision, clarity, and adaptability makes it suitable for Scalping, swing, and long-term trading strategies.
In summary, the MACD Colored Histogram Indicator provides enhanced market analysis through color-coded momentum signals, helping traders identify bullish and bearish trends, spot reversals, and make more informed trading decisions.
FAQ
2 Downloads
Published:
Feb 25, 2026 10:21 AM
Category: