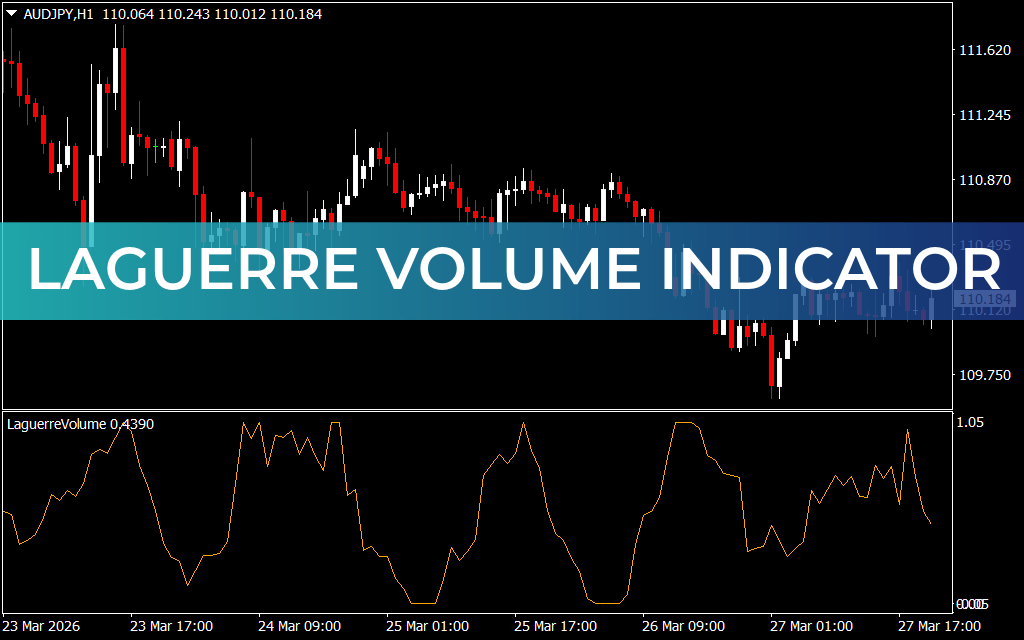
The Laguerre Volume Indicator for MT4 is a powerful custom trading tool designed to identify overbought and oversold zones based on market volume. By analyzing volume behavior around key Support And Resistance levels, it helps traders detect potential price exhaustion and trend reversals with greater accuracy.
Key Features of Laguerre Volume Indicator
- Volume-Based Reversal Signals: Detects price exhaustion using volume analysis.
- Clear Threshold Levels: Values above 0.8 indicate overbought conditions, while values below 0.2 indicate oversold conditions.
- User-Friendly Design: Simple and chart-friendly, suitable for all trader levels.
- Versatile Application: Ideal for scalpers, intraday traders, and day traders.
How to Trade with Laguerre Volume Indicator
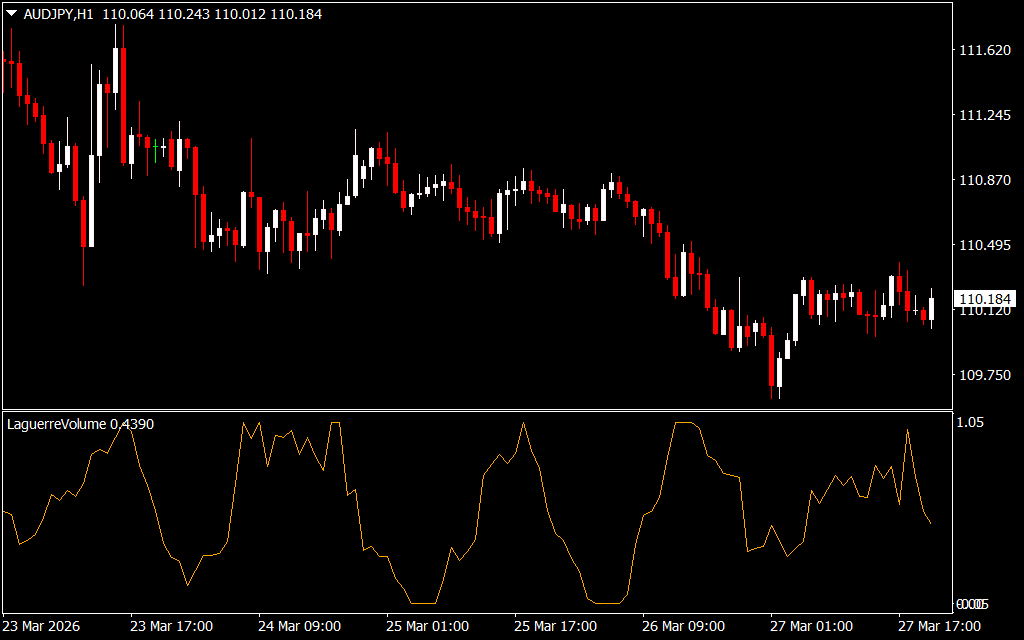
The indicator provides signals based on level crossovers and price confirmation:
- Buy Signal: When the indicator line crosses above the 0.2 level, it indicates an oversold condition and potential bullish reversal. Confirm with bullish Price Action before entering a buy trade.
- Sell Signal: When the indicator line crosses below the 0.8 level, it signals an overbought condition and potential bearish reversal. Confirm with bearish price action before entering a sell trade.
For best results, combine the indicator with support/resistance zones, candlestick patterns, or other technical indicators to filter false signals and improve accuracy.
Why Traders Use Laguerre Volume Indicator
The Laguerre Volume Indicator is ideal for traders who rely on volume and price exhaustion analysis. It simplifies the identification of reversal zones while providing clear and actionable signals.
Conclusion
In summary, the Laguerre Volume Indicator for MT4 is an effective tool for identifying overbought and oversold zones based on volume behavior. When used alongside other technical analysis tools, it can significantly improve trade timing and decision-making.
FAQ
Published:
Mar 28, 2026 10:50 AM
Category: