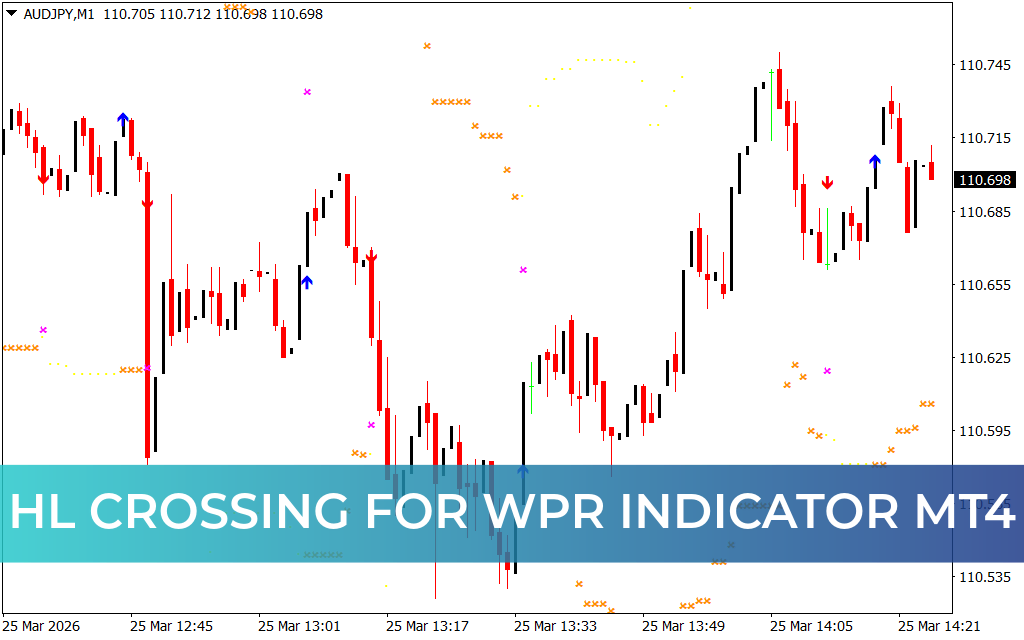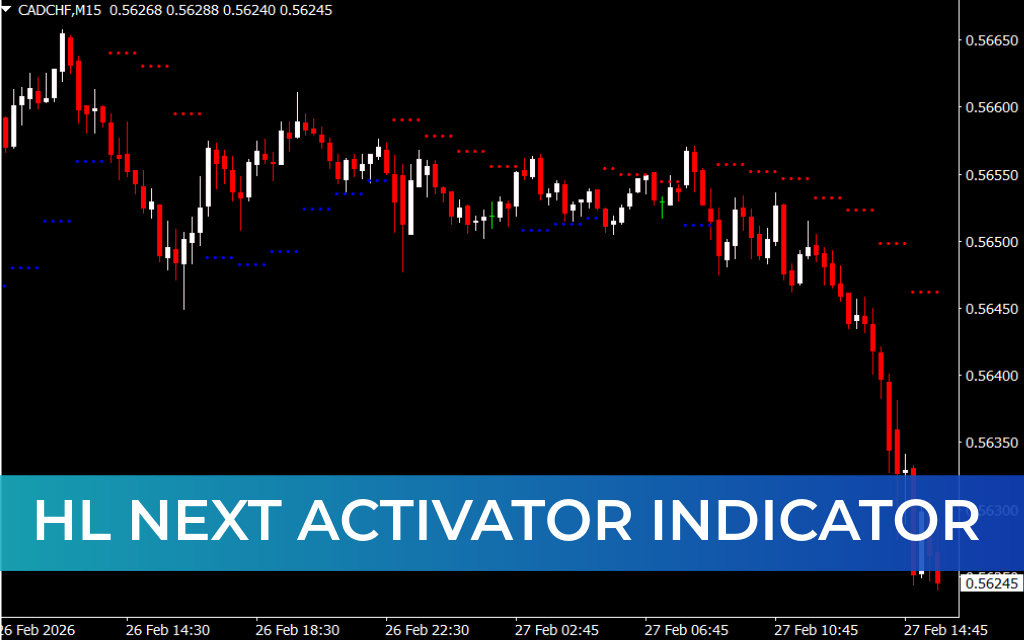
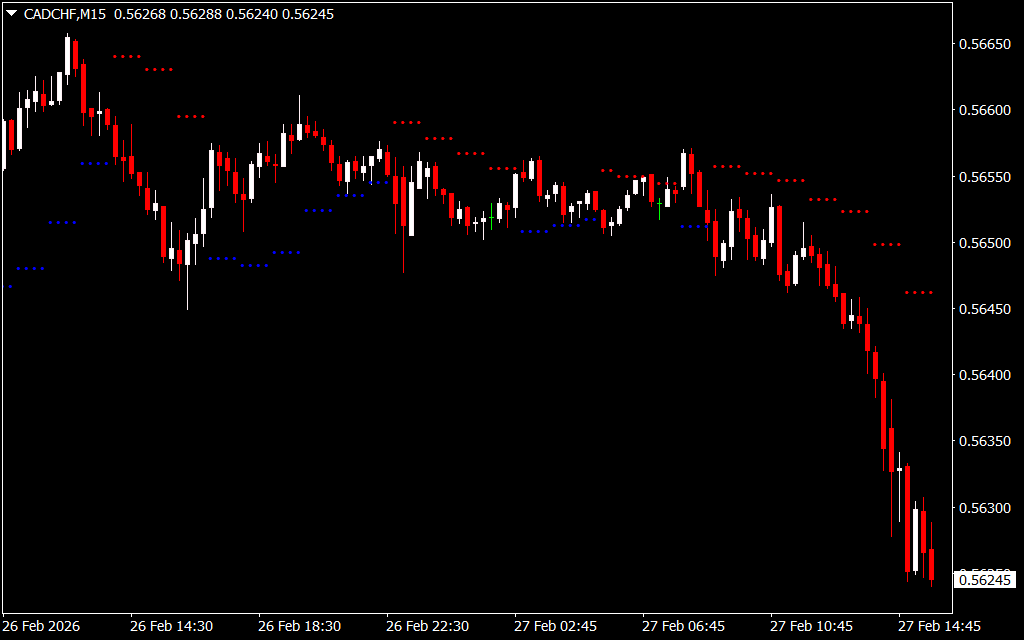
The Forex HL Next Activator is a simple yet effective trading indicator that plots dots above or below candlesticks to indicate market trends. These dots not only reveal the current trend direction but can also act as dynamic Support And Resistance, helping traders anticipate potential reversals.
Ideal for both beginner and experienced traders, this tool provides a visual, easy-to-understand representation of trend direction on any MT4 chart.
How the HL Next Activator Works
The indicator uses colored dots to signal market conditions:
- Blue Dots Below Candles – Indicate an uptrend and potential buy opportunity
- Red Dots Above Candles – Indicate a downtrend and potential sell opportunity
Trading Strategy
- Trend Following
- Enter a long trade when blue dots appear below the candles.
- Enter a short trade when red dots appear above the candles.
- Reversal Trading
- During price consolidation, a break above red dots signals a potential bullish reversal → enter long.
- A break below blue dots during consolidation signals a potential bearish reversal → enter short.
- Confirmation
- Use additional technical indicators or Price Action to confirm signals.
- Test different settings on a demo account to optimize performance before live trading.
Key Benefits
- Provides clear visual trend signals with dots
- Helps identify potential support and resistance zones
- Works on all MT4 timeframes and Forex pairs
- Simple to use, suitable for both beginners and experienced traders
- Supports both trend-following and reversal strategies
By providing visual cues for trend direction and potential reversals, the HL Next Activator helps traders make faster, more informed trading decisions.
Who Should Use This Indicator?
- Forex scalpers, intraday, and swing traders
- Beginner traders looking for simple trend signals
- Advanced traders using trend and reversal strategies
- Traders combining multiple indicators for confirmation
- Anyone testing strategies on MT4 before going live
Conclusion
The HL Next Activator is a straightforward Trend Indicator that plots dots to indicate bullish and bearish conditions. While it provides useful trend and potential reversal signals, it should not be used alone. Combining it with other indicators or price action analysis enhances trade accuracy. Always test it on a demo account before live trading.
FAQ
Published:
Feb 27, 2026 10:00 AM
Category: