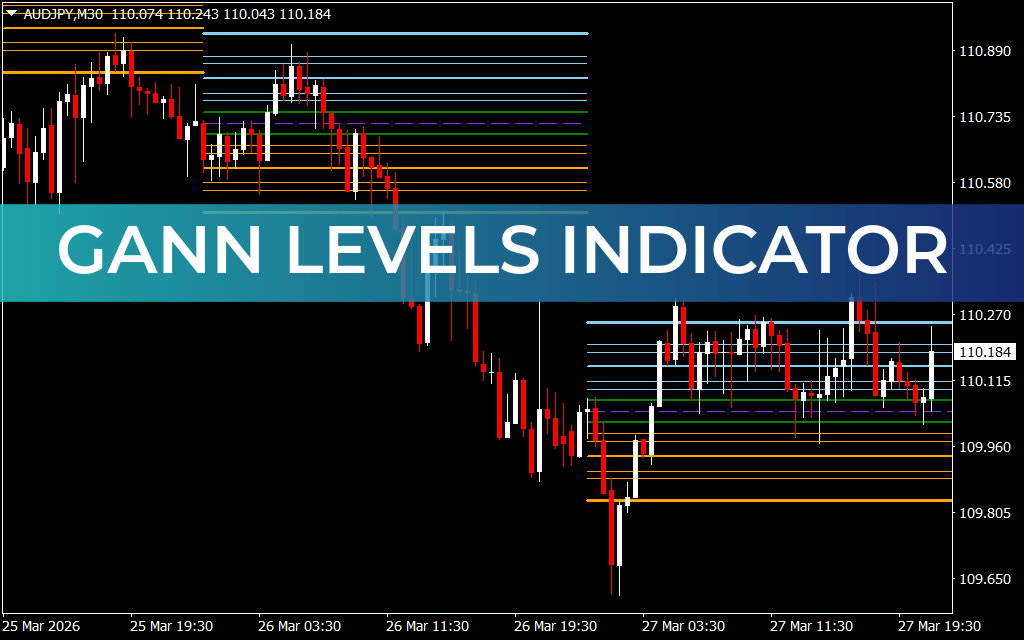
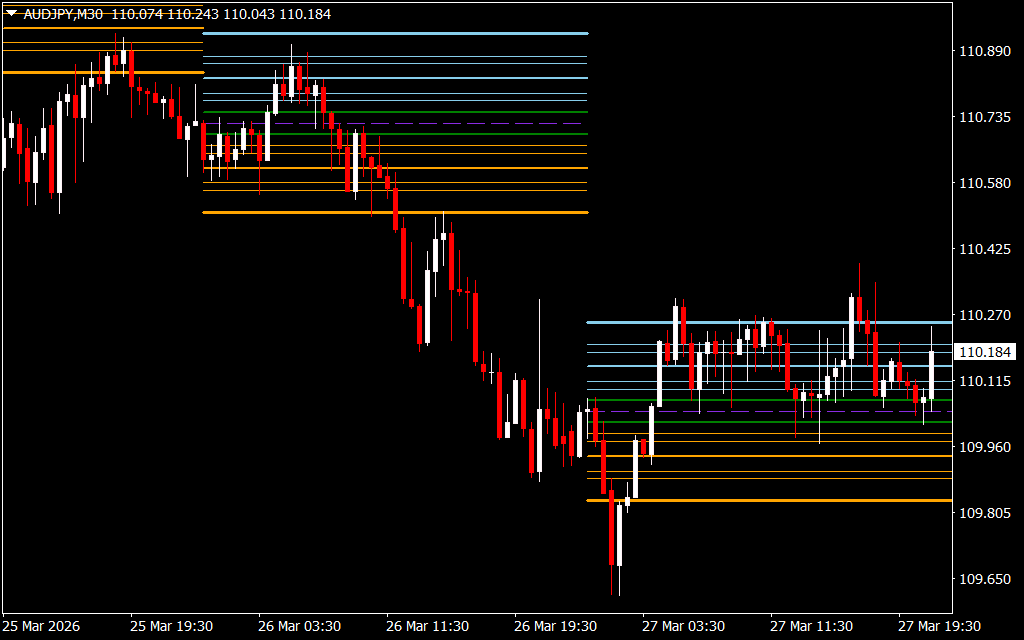
The Gann Levels Indicator for MT4 is a powerful technical analysis tool designed for traders who want to apply W.D. Gann’s proven market theories. This indicator automatically plots key price levels on your chart, helping you identify critical support, resistance, and potential Trend Reversal zones with precision.
By incorporating Gann’s geometric and mathematical principles, the indicator simplifies complex Price Action and provides a structured view of the market. Whether you're a beginner or an experienced trader, it offers a clear and reliable framework to navigate volatile forex markets with confidence.
Enhance Your Strategy with Gann-Based Tools
If you're exploring Gann trading techniques, you can further strengthen your analysis by combining this tool with advanced indicators like the Gann SQ9 (Square of 9) Indicator and the Gann Made Easy Indicator. These tools complement the Gann Levels Indicator by adding deeper geometric insights and improving timing accuracy.
My Experience Using the Gann Levels Indicator
When I first installed the Gann Levels Indicator, I was impressed by its simplicity. It’s truly plug-and-play—once attached to the chart, it automatically calculates and displays levels without requiring manual input.
I tested it across multiple currency pairs and timeframes, particularly on H4 and Daily charts, where it performed exceptionally well. The plotted levels consistently aligned with real market reactions, acting as reliable Support And Resistance zones.
What stood out most was the minimal configuration required. With just slight adjustments to the number of levels to match my swing trading strategy, the indicator worked smoothly right out of the box.
Gann Levels Indicator Trading Signals
The indicator maps horizontal price levels that act as key decision zones in the market:
- When price approaches a level, it may bounce, indicating strong support or resistance
- A break above a level often signals bullish momentum
- A break below suggests bearish pressure
These insights help traders identify high-probability entry and exit points while assessing overall Trend Strength.
Pros and Cons of the Gann Levels Indicator
✅ Pros
- Automatically calculates key levels using Gann’s formulas
- Highly visual and beginner-friendly
- Works effectively on all timeframes (best on H1, H4, D1)
- Minimal setup required—ready to use instantly
- Pairs well with price action, trendlines, and Fibonacci tools
❌ Cons
- Does not provide direct buy/sell signals
- Requires confirmation from other indicators in volatile markets
- Beginners may need time to understand Gann theory
Conclusion
The Gann Levels Indicator for MT4 is an excellent addition to any trader’s toolkit. It simplifies price action, highlights key market levels, and helps traders make more informed decisions.
Whether you're aiming to identify strong support and resistance zones or anticipate trend reversals, this indicator delivers consistent value. Its ease of use and analytical power make it suitable for traders of all experience levels.
Frequently Asked Questions (FAQ)
Does the Gann Levels Indicator repaint?
No, the levels remain fixed once plotted. They are calculated based on initial price data and do not repaint.
What is the best timeframe to use it?
While it works on all timeframes, the most reliable results are typically seen on H1, H4, and D1 charts.
Can it be used with automated trading systems?
Yes, some Expert Advisors (EAs) can recognize these levels, but manual confirmation is recommended for better accuracy.
How is it different from standard support/resistance tools?
Unlike basic horizontal lines, this indicator uses Gann’s mathematical and geometric principles to calculate deeper, more strategic price levels aligned with potential turning points.
FAQ
4 Downloads
Published:
Mar 29, 2026 12:26 PM
Category: