The forex market stands out as one of the most dynamic financial markets in the world, largely due to its 24-hour trading cycle. This continuous activity creates constant price movement and volatility, offering traders numerous opportunities to identify profitable entry and exit points.
Because traders operate across different time zones—from Asia to Europe and North America—market activity never truly stops. While some traders are active, others are offline, ensuring a steady flow of liquidity and Price Action at all times.
However, one limitation of the MetaTrader 5 (MT5) platform is the absence of a built-in tool to clearly display global trading sessions. This is where the FXSSI Trading Sessions Indicator becomes incredibly useful.
What Is the FXSSI Trading Sessions Indicator?
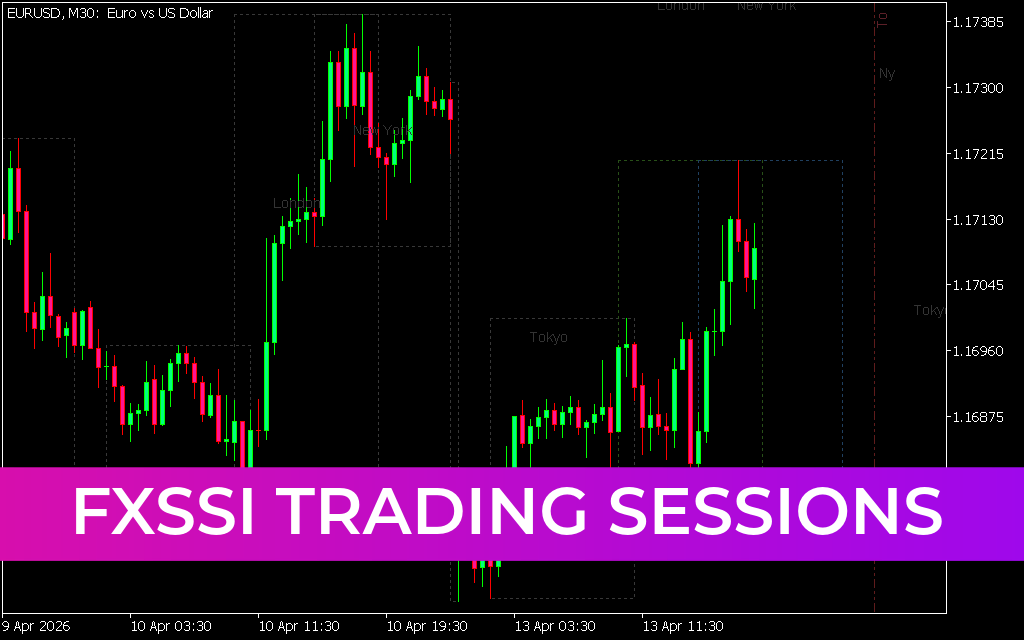
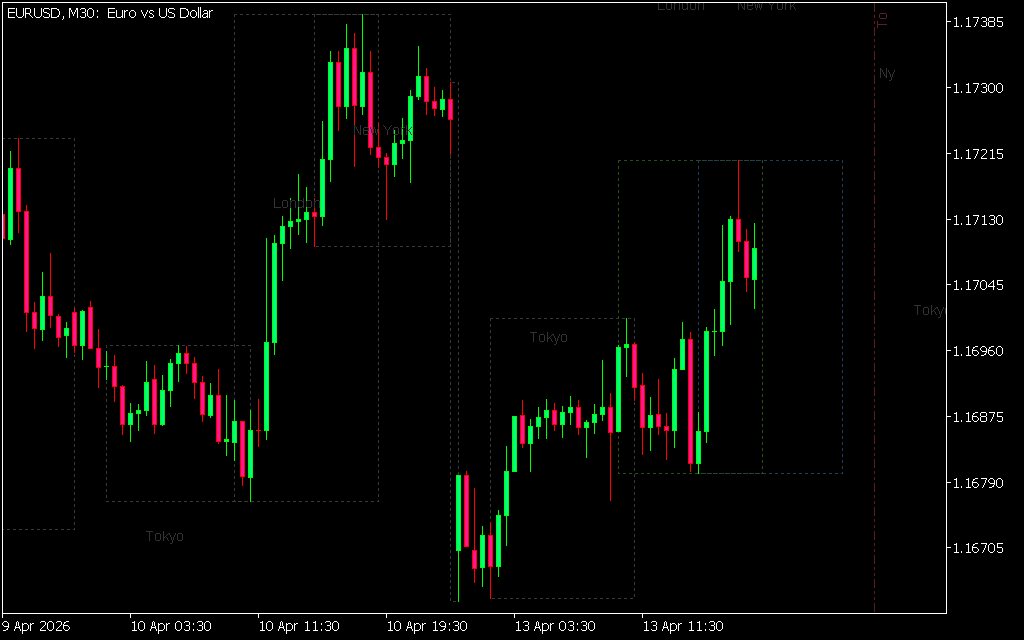
The FXSSI Trading Sessions Indicator is a powerful and free tool designed to visually display major forex trading sessions directly on your MT5 chart. It helps traders understand when different markets are active and how price behaves during those periods.
Key Features
- Displays major trading sessions (Sydney, Tokyo, London, New York)
- Highlights sessions using rectangular zones on charts
- Shows both past and upcoming sessions
- Includes session abbreviations for easy identification
- Adjusts automatically based on the selected timeframe
Forex Trading Sessions and Overlaps
Each forex trading session typically lasts around 9 hours, and some sessions overlap—creating periods of increased volatility.
Major Overlaps
- Tokyo & London: 1-hour overlap
- London & New York: 4-hour overlap
- Sydney & Tokyo: 7-hour overlap
Among these, the London and New York overlap is considered the most active and volatile, making it a prime time for trading opportunities.
How the Indicator Works
The indicator uses rectangles to mark trading sessions on the chart:
- Width: Represents the duration of the session (fixed per timeframe)
- Height: Reflects price movement during the session
- Labels: Session abbreviations appear in the top-left corner
For example, on the M30 timeframe, a trading session spans 18 bars.
Timeframe Compatibility
- Minimum supported timeframe: M30
- On higher timeframes (H1 and above), the indicator simplifies its display to maintain clarity
How to Use the Indicator in Trading
While the Trading Sessions Indicator does not generate direct buy or sell signals, it becomes highly effective when combined with other technical analysis tools.
Practical Strategy Example
- Use tools like trend lines to identify market direction
- Observe price behavior during London and New York sessions
- Look for:
- Strong bullish or bearish waves
- Long candle shadows indicating rejection
If buying interest increases during high-volume sessions, it may signal the start of a new trend.
Trade Setup Tips
- Place a pending order at key breakout levels
- Set stop-loss beyond trend lines or candle shadows
- Monitor session overlaps for increased volatility and confirmation
Why Use a Trading Sessions Indicator?
Understanding when the market is most active can significantly improve your trading decisions. This indicator helps you:
- Identify high-volatility periods
- Avoid trading during low-liquidity sessions
- Align strategies with institutional trading hours
- Improve timing of entries and exits
Final Thoughts
The FXSSI Trading Sessions Indicator is an essential tool for forex traders who want to better understand market timing and volatility. By visualizing global trading sessions, it provides valuable context that can enhance any trading strategy.
Whether you're a beginner or an experienced trader, integrating session-
2 Downloads
Published:
Apr 13, 2026 11:58 AM
Category: