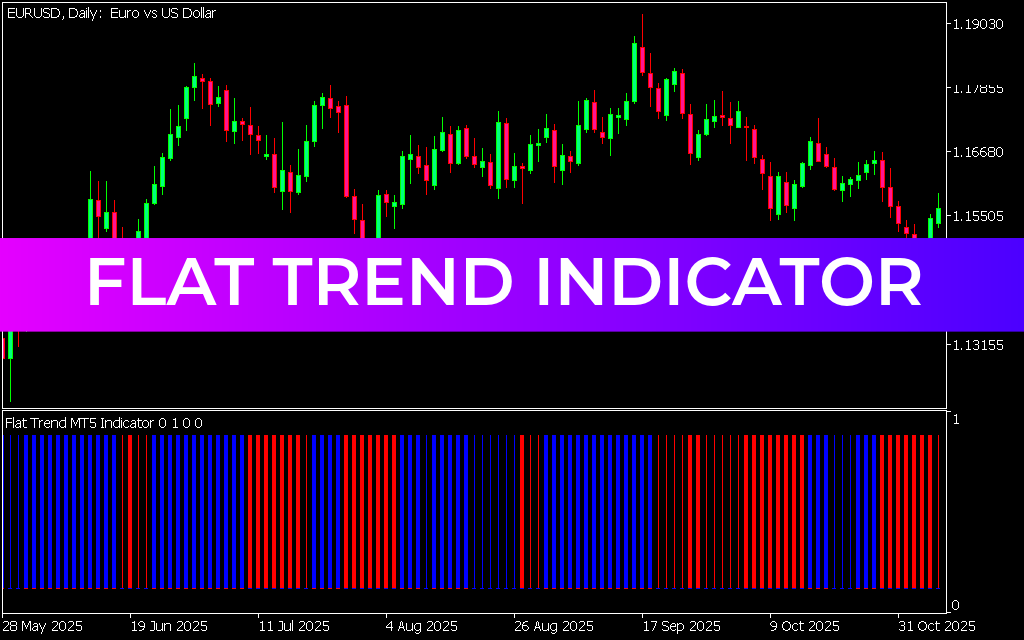
The Flat Trend Indicator for MetaTrader 5 is a trend-following technical tool designed to help traders quickly identify market direction and consolidation phases. It combines three moving averages (fast, medium, and slow) into a single oscillator-style window below the price chart, making trend interpretation simple and visual.
This indicator is especially useful for traders who want a clear understanding of whether the market is trending or ranging.
What Is the Flat Trend Indicator?
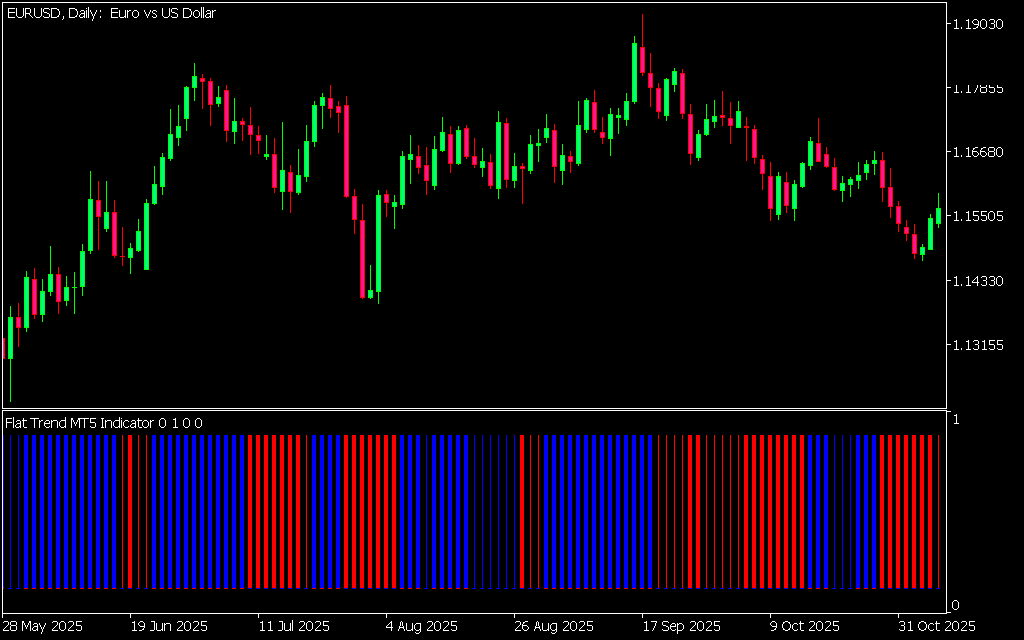
The Flat Trend Indicator analyzes the relationship between multiple moving averages to determine Market Structure. Instead of plotting lines on the price chart, it displays color-coded bars in a separate window for easier reading.
Key Features:
- Combines fast, medium, and slow moving averages
- Displays Trend Strength in a separate window
- Uses color-coded bars for easy interpretation
- Helps identify trending and ranging markets
- Fully customizable settings
How the Flat Trend Indicator Works
The indicator uses three types of visual signals:
- Blue bars → Bullish trend (BUY signal)
- Red bars → Bearish trend (SELL signal)
- Thin bars (blue/red) → Market consolidation or flat trend
This structure helps traders avoid low-quality sideways markets and focus on trending conditions.
How to Trade with Flat Trend Indicator
BUY Strategy:
- Wait for thin bars (market consolidation phase)
- Watch for a transition from thin bars → blue bars
- Enter a BUY trade after confirmation
- Place Stop Loss below recent swing low
- Exit when bars turn red or show weakening momentum
SELL Strategy:
- Wait for thin bars indicating a range market
- Watch for transition from thin → red bars
- Enter a SELL trade once bearish trend confirms
- Place Stop Loss above recent swing high
- Exit when bars turn blue or trend weakens
Exit Strategy
Proper exits are crucial for consistent trading performance:
- Exit BUY trades when bars change from blue → thin → red
- Exit SELL trades when bars change from red → thin → blue
These transitions often signal trend reversals or market exhaustion.
Best Market Conditions for Flat Trend Indicator
The indicator performs best in:
- Strong trending markets
- Breakout environments
- High volatility sessions
It also helps traders avoid sideways markets where false signals are more common.
Why Traders Use the Flat Trend Indicator
- Clearly separates trending vs ranging markets
- Simple color-based signal system
- Works across all timeframes
- Useful for Scalping and intraday trading
- Helps improve trade timing and discipline
Trading Tips for Better Accuracy
To improve results, combine the Flat Trend Indicator with:
- Support and resistance levels
- Price Action confirmation
- Higher timeframe trend analysis
- Volatility filters
This helps reduce false signals and improves trade quality.
Final Thoughts
The Flat Trend Indicator for MT5 is a simple yet effective tool for identifying market direction using a multi-moving-average system. Its color-coded structure makes it easy for traders to recognize trend phases and avoid low-probability market conditions.
When used with proper confirmation tools and risk management, it can significantly improve trading consistency and decision-making.
4 Downloads
Published:
Apr 14, 2026 09:13 AM
Category: