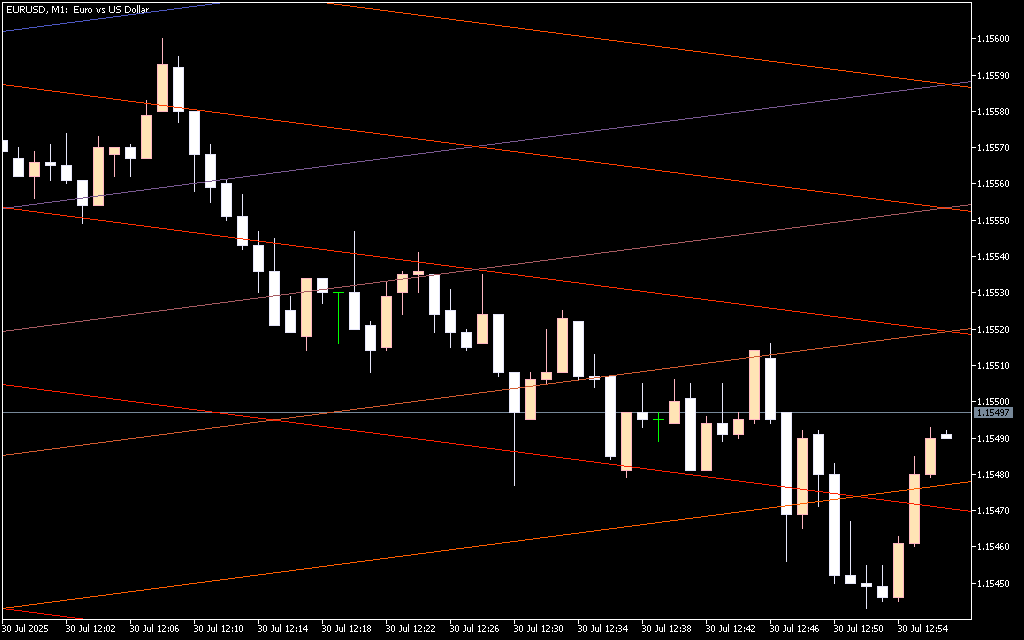
The Fibonacci Grid Indicator for MetaTrader 5 is a sophisticated technical analysis tool developed by LuxAlgo, leveraging Fibonacci ratios and geometric price symmetry. It overlays a dynamic multi-angled grid on your chart, helping traders visually identify key support, resistance, and reaction zones. This framework is ideal for intraday Scalping, swing trading, and strategies emphasizing price geometry, fractal behavior, or confluence zones.
How the Fibonacci Grid Indicator Works
Unlike traditional signal-based indicators, the Fibonacci Grid provides a structured framework for price interaction:
- Dynamic Grid Lines: Horizontal and diagonal lines adjust based on Market Structure and price action.
- Support and Resistance: Price reacting to grid lines from below indicates support, while reversals from above signal resistance.
- Trend Adaptation: The grid aligns with prevailing trends, helping identify breakout and reversion zones.
- Precision Targeting: Traders use the grid for entry, stop-loss placement, and profit-taking.
This approach helps traders visualize market rhythm, geometric patterns, and potential zones of confluence without cluttering the chart with signals.
Benefits for Traders
- Provides a clear, Fibonacci-based visual structure for price analysis.
- Helps identify key reversal, continuation, and breakout zones.
- Adapts dynamically to market trends and swings.
- Supports precise risk management and trade planning.
- Suitable for all timeframes, from scalping to long-term swing trading.
Why Use the Fibonacci Grid Indicator
The Fibonacci Grid Indicator MT5 equips traders with a visual map of market geometry, enabling more confident decision-making. By highlighting zones of potential reaction based on Fibonacci ratios, it enhances trend analysis, risk management, and trade precision. It’s an essential tool for traders who value price structure, confluence, and fractal behavior in their strategies.
FAQ
Published:
Mar 01, 2026 13:00 PM
Category: