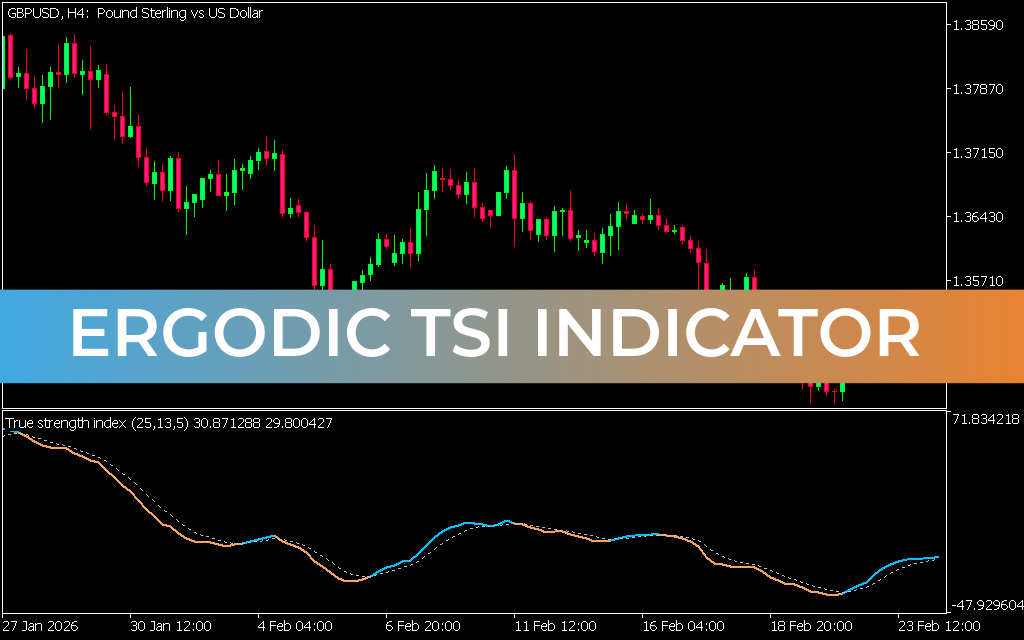
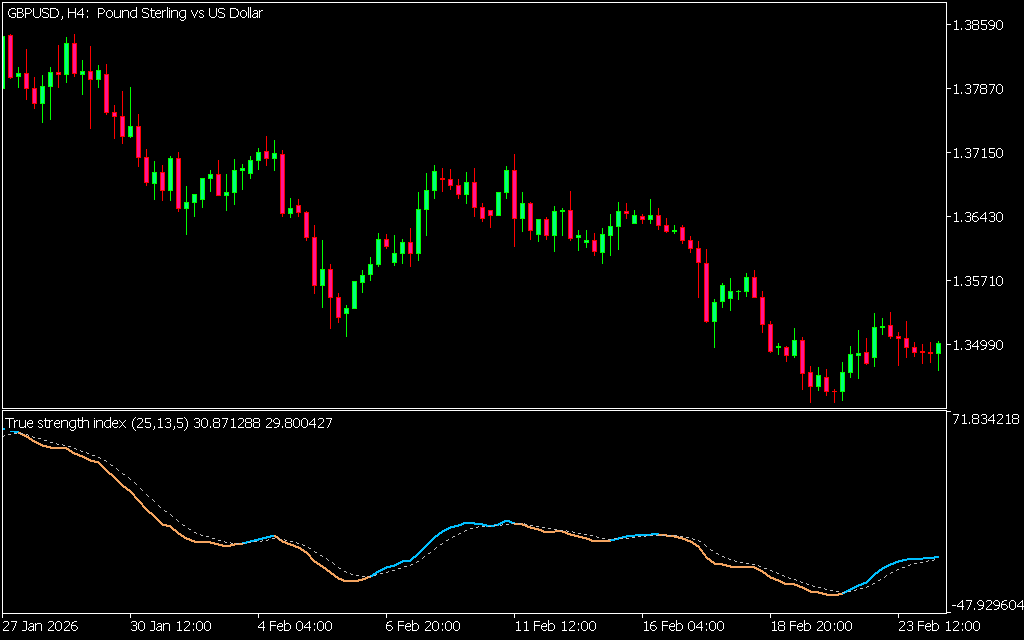
The Ergodic True Strength Index (TSI) Indicator, developed by William Blau, is a momentum oscillator similar to the MACD. It combines histograms with a smoothed moving average that oscillates around the zero line, making it easy to spot bullish and bearish market conditions. Plotted in a separate window beneath the price chart, the Ergodic TSI can be applied to any instrument and timeframe, from Scalping to long-term trading.
Key Features
- Zero Line Oscillator: Identifies bullish and bearish zones based on crossovers.
- Histogram Display: Provides a clear visual of momentum shifts.
- Multi-Timeframe Support: Effective for short-term and long-term strategies.
- Simple Interpretation: Easy for beginners yet powerful for experienced traders.
- Versatile Application: Works across forex, stocks, and commodities.
How to Use the Ergodic TSI Indicator
Trading with the Ergodic TSI is straightforward:
- BUY Signal: When the indicator crosses above the zero line from below, traders can enter long positions.
- SELL Signal: When the indicator crosses below the zero line from above, traders can enter short positions.
For example, on the EUR/JPY daily chart, the indicator generated a BUY signal when the bars rose above the zero line. Later, it crossed below the line, signaling bearish control and a short entry opportunity.
Benefits of Using the Indicator
- Clear Buy/Sell Signals: Easy-to-follow rules based on zero line crossovers.
- Momentum Insight: Helps traders understand when bulls or bears dominate.
- Flexible Strategy Integration: Can be used alone or with other indicators for confirmation.
- Free Download: Available at no cost for MT5 users.
Conclusion
The Ergodic TSI Indicator is a simple yet effective oscillator that provides direct BUY and SELL signals. By focusing on zero line crossovers, traders can align with market momentum and refine their strategies. Download it for free today and add Ergodic TSI analysis to your MT5 trading toolkit.
2 Downloads
Published:
Apr 11, 2026 13:35 PM
Category: