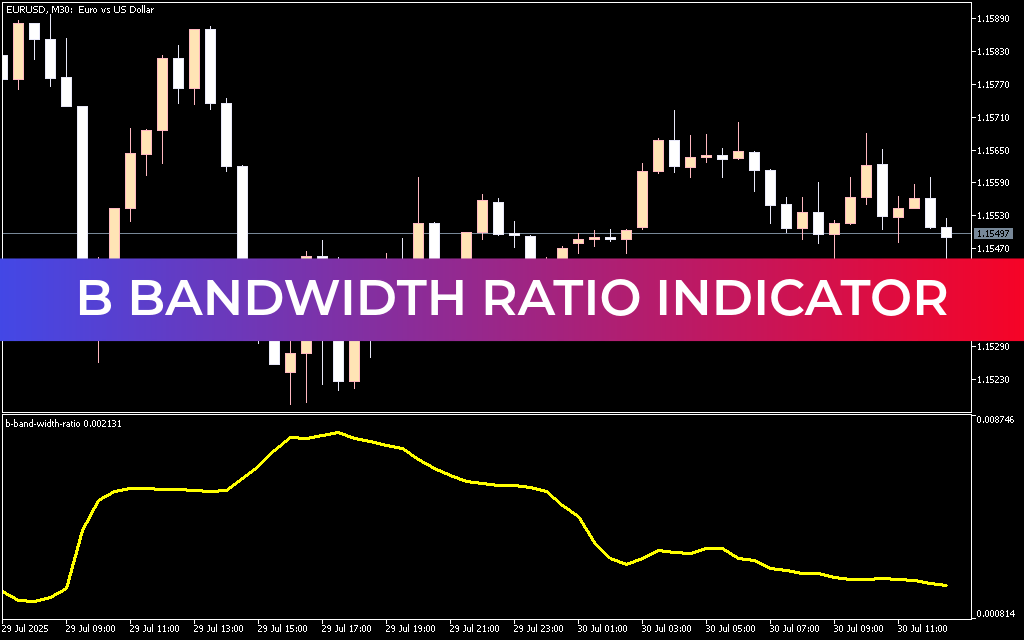
The B Bandwidth Ratio Indicator for MT5 is a volatility analysis tool that measures the distance between the upper and lower Bollinger Bands and displays it as a histogram or oscillator. This distance represents market volatility, helping traders understand when the market is quiet and when a strong price movement may be approaching.
When volatility increases, the distance between the Bollinger Bands expands, resulting in higher bandwidth values. Conversely, when volatility decreases, the bands move closer together, creating lower bandwidth values. This behavior makes the indicator especially useful for identifying volatility cycles in the Forex market.
Developed around the principles of Bollinger Bands, the B Bandwidth Ratio indicator helps traders anticipate potential market activity. According to John Bollinger, periods of low volatility are often followed by strong price movements, which makes monitoring bandwidth changes extremely valuable for trading preparation.
Key Features of the B Bandwidth Ratio Indicator
- Measures volatility based on Bollinger Bands width
- Displays a histogram or oscillator showing bandwidth changes
- Helps identify Bollinger Bands squeeze patterns
- Works on all timeframes, including intraday and higher timeframes
- Suitable for both beginner and advanced traders
- Compatible with MetaTrader 5 (MT5)
How the Indicator Works
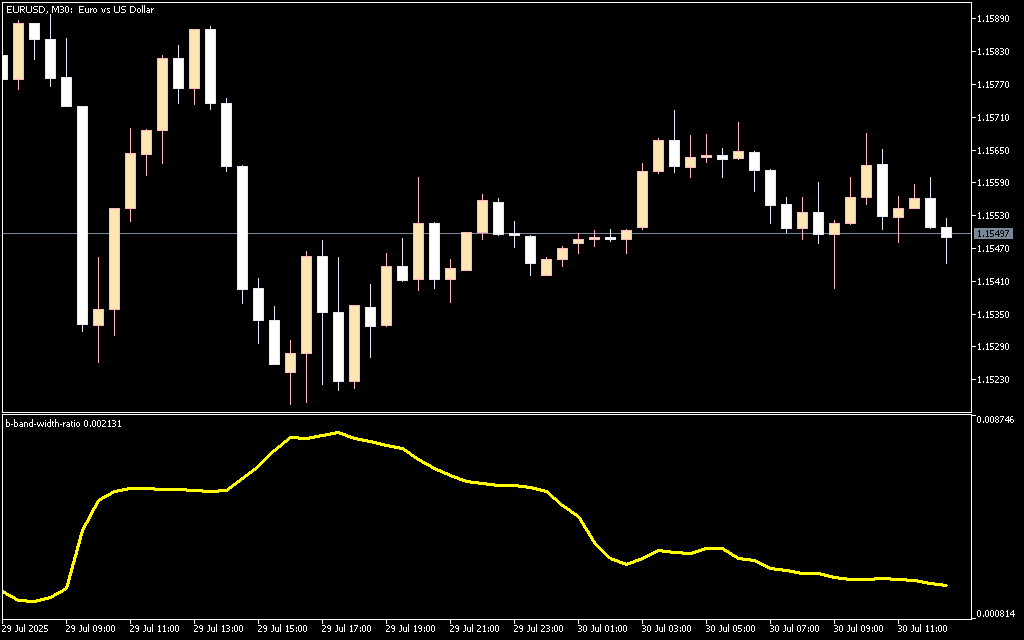
The B Bandwidth Ratio indicator calculates the difference between the upper and lower Bollinger Bands and plots it as an oscillator line.
- Wider bands indicate high volatility
- Narrow bands indicate low volatility
The oscillator typically appears as a yellow line that fluctuates depending on changes in market volatility.
This information helps traders determine whether the market is preparing for a breakout or entering a quiet consolidation phase.
Identifying the Bollinger Bands Squeeze
One of the most important patterns detected with this indicator is the Bollinger Bands squeeze.
A squeeze occurs when:
- The upper and lower bands move closer together
- The bandwidth value drops to a low level
- Market volatility becomes very low
According to Bollinger Bands trading principles, low volatility periods are often followed by strong price movements.
Traders use this signal to prepare for potential breakout trades.
Trading Strategy Using the B Bandwidth Ratio
Although the B Bandwidth Ratio indicator does not provide direct buy or sell signals, it plays an important role in volatility-based trading strategies.
Typical approach:
- Identify a squeeze pattern where bandwidth values become very low.
- Wait for price confirmation or breakout using other indicators.
- Enter trades in the direction of the breakout.
Because volatility often increases after a squeeze, traders typically adjust stop loss levels to accommodate larger price movements.
Best Use with Other Indicators
Since the B Bandwidth Ratio indicator focuses on volatility rather than direction, it is best used alongside other technical tools such as:
- Bollinger Bands
- Trend indicators
- Support and resistance levels
- Momentum indicators
Combining these tools allows traders to identify both volatility and market direction, leading to more accurate trading decisions.
Conclusion
The B Bandwidth Ratio Indicator for MT5 is an essential tool for traders who rely on Bollinger Bands and volatility analysis. By measuring the distance between the bands, the indicator helps traders identify squeeze patterns and potential market breakouts.
While it does not generate direct trading signals, it provides valuable insights into when the market may experience strong price movements, making it a powerful addition to any Forex trading strategy.
FAQ
Published:
Mar 09, 2026 10:57 AM
Category: