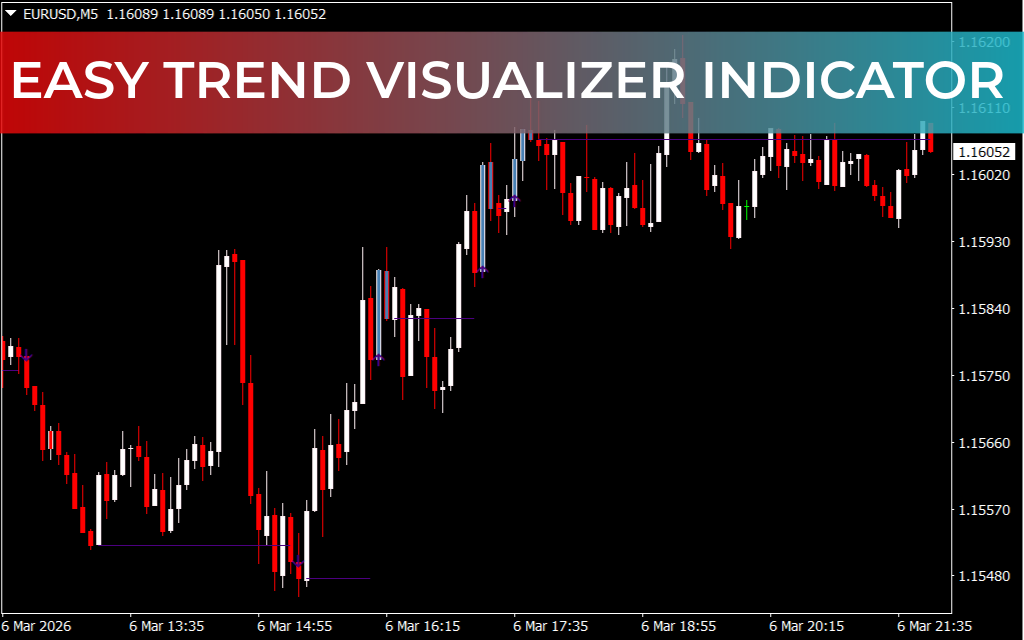
The Easy Trend Visualizer Indicator for MetaTrader 4 (MT4) is a dynamic forex trading tool designed to help traders easily identify trend direction, Trend Strength, and potential entry or exit points. The indicator is built using three Average Directional Index (ADX) calculations, which provide a visual representation of changing market conditions.
This indicator displays arrows and horizontal bars directly on the chart, making it easy for traders to recognize when a new trend may begin or when an existing trend may be ending. Because of its clear visual signals, the Easy Trend Visualizer is suitable for beginner, intermediate, and advanced forex traders.
Key Features of the Easy Trend Visualizer Indicator
The Easy Trend Visualizer indicator simplifies trend analysis with easy-to-read visual signals.
Main features include:
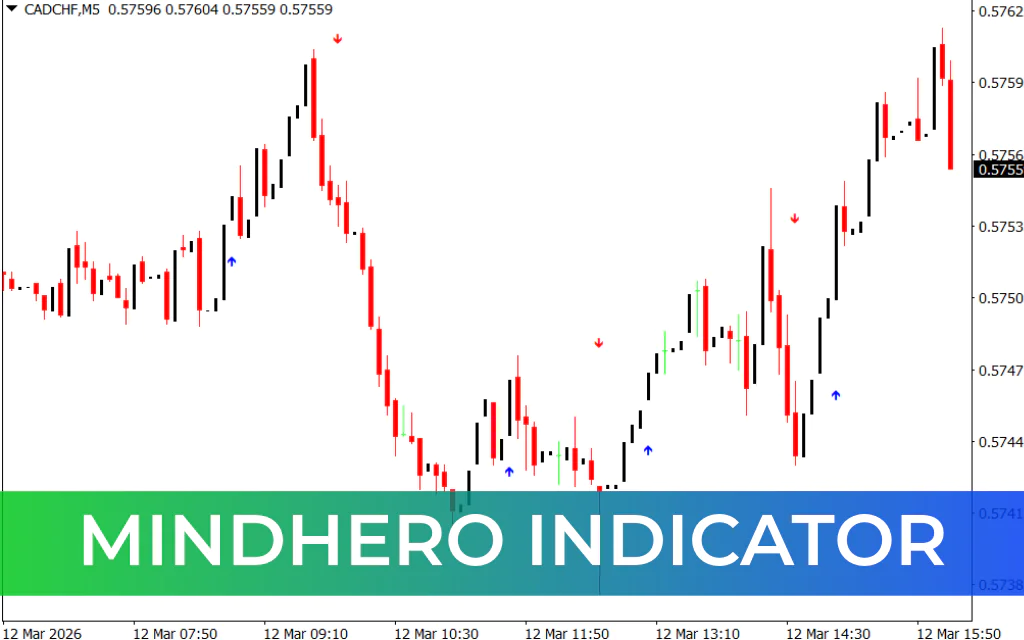
- Arrow signals indicating potential trend beginnings
- Horizontal bars signaling possible trend endings
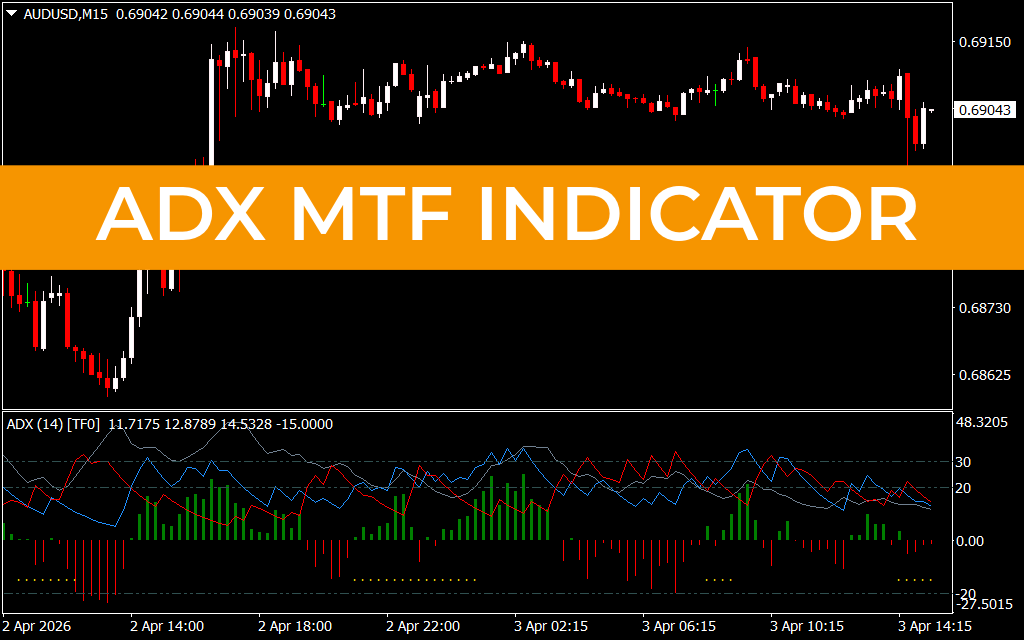
- Built using three ADX calculations for improved accuracy
- Works across multiple timeframes
- Provides clear buy and sell signals
These visual signals help traders quickly understand the market trend without needing complex analysis.
How the Indicator Works
The Easy Trend Visualizer indicator uses ADX-based calculations to detect changes in market momentum and trend direction.
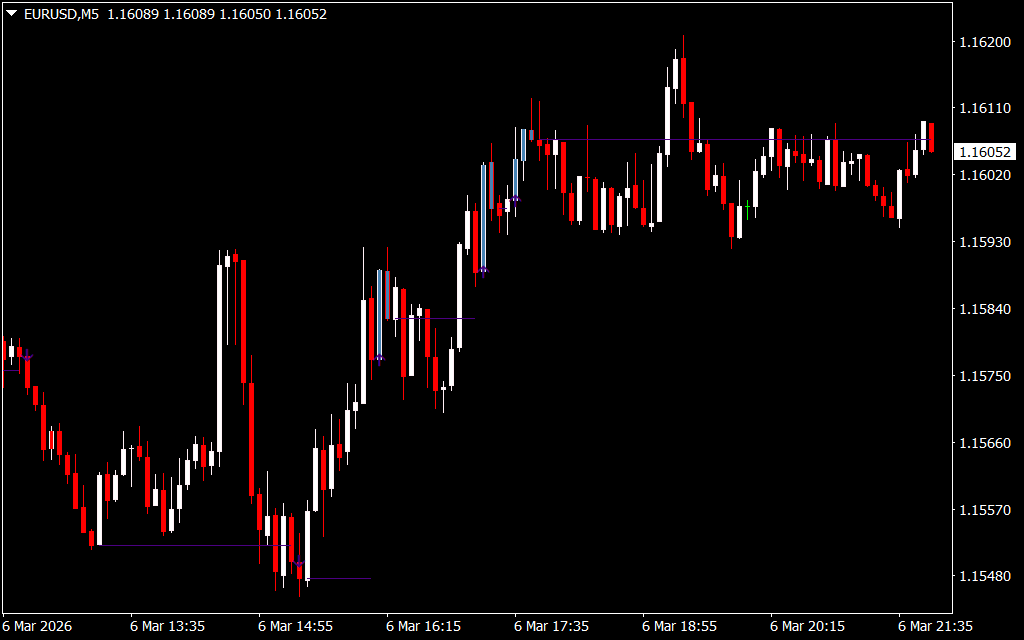
Arrow Signals
Arrows appear on the chart when the indicator detects a potential start of a new trend.
- Up arrow – Possible bullish trend and potential buy signal.
- Down arrow – Possible bearish trend and potential sell signal.
These arrows often serve as trade entry signals.
Horizontal Bar Signals
Horizontal bars indicate a possible end of the current trend.
When these bars appear, traders may consider:
- Closing an existing trade
- Locking in profits
- Waiting for the next trend signal
This feature helps traders manage trade exits more effectively.
How to Trade With the Easy Trend Visualizer Indicator
The indicator works best when combined with Price Action analysis.
Example Buy Setup
- An up Arrow Signal appears on the chart.
- Price action confirms bullish momentum.
- Traders open a buy position in the direction of the trend.
Example Sell Setup
- A down arrow signal appears.
- Price forms a double top pattern.
- A bearish engulfing candlestick pattern confirms the reversal.
- Traders may enter a sell trade.
Using price action confirmation helps filter false signals and improve trade accuracy.
Best Trading Styles for This Indicator
The Easy Trend Visualizer indicator works well for different trading strategies, including:
- Scalping
- Intraday trading
- Day trading
- Swing trading
It can also be applied across various timeframes such as M15, H1, H4, and Daily charts.
Conclusion
The Easy Trend Visualizer Indicator for MT4 is a powerful and user-friendly tool that helps traders quickly identify trend beginnings and endings. With its arrow-based entry signals and horizontal exit indicators, traders can easily determine when to enter or exit trades.
Its visual simplicity and ADX-based calculations make it a reliable indicator for traders who want to improve trend analysis and trading decisions. Best of all, the indicator is completely free to download and easy to install on MetaTrader 4.
FAQ
Published:
Mar 07, 2026 16:13 PM
Category: