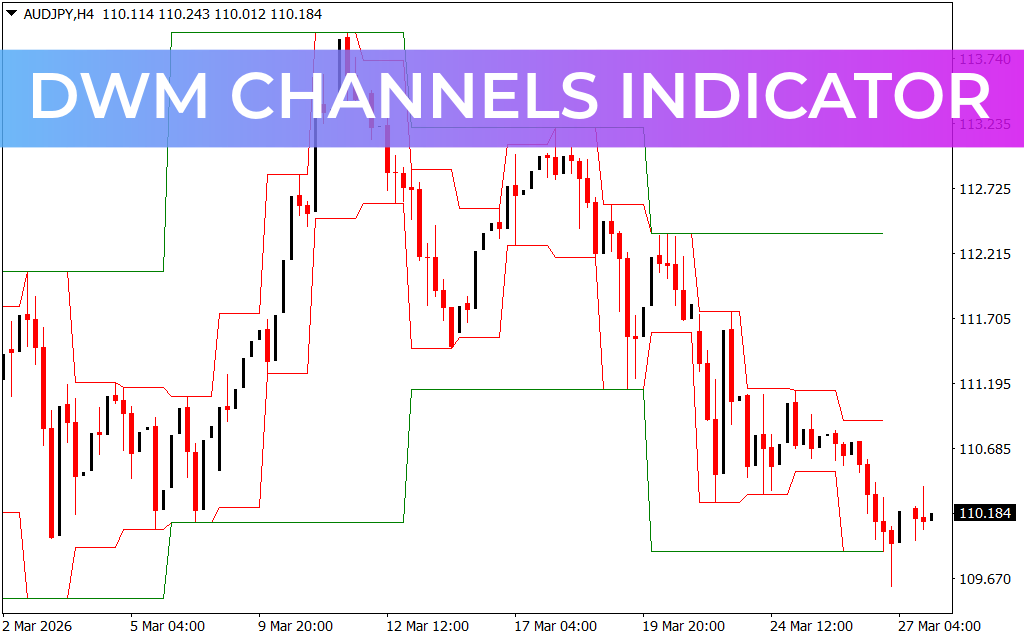
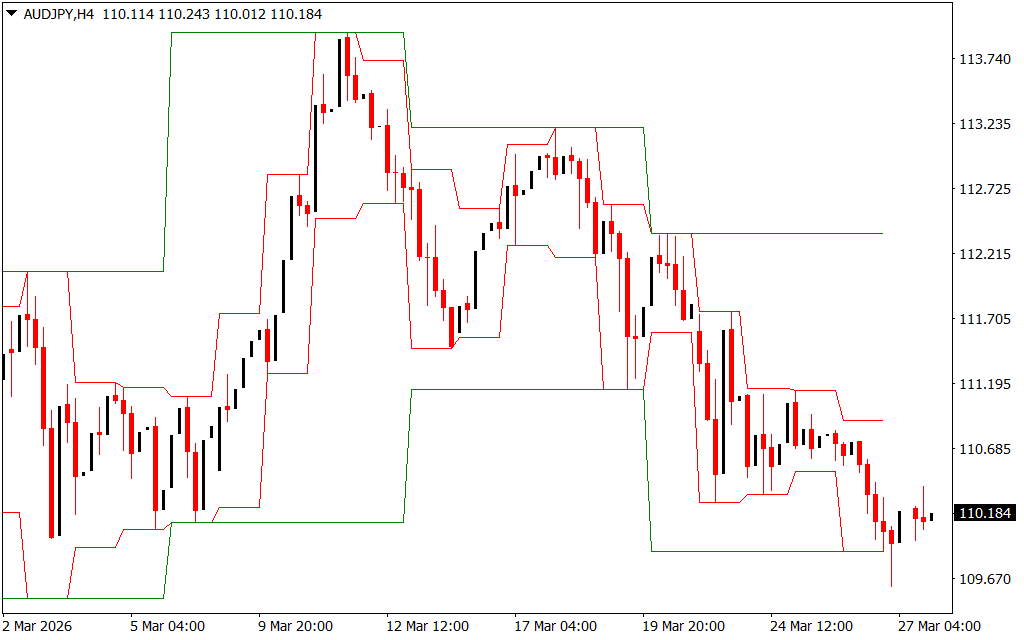
The DWM Channels Indicator for MT4 is a powerful multi-timeframe tool that plots dynamic price channels based on the Daily, Weekly, and Monthly (DWM) highs and lows. By displaying these higher timeframe levels directly on a single chart, it helps forex traders identify key Support And Resistance zones and anticipate potential price reversals.
This indicator provides a clear view of the “big picture,” allowing traders to align their strategies with higher timeframe Market Structure for more accurate trading decisions.
Key Features of DWM Channels
- Multi-Timeframe Channels:
- Red Channel: Daily highs and lows
- Green Channel: Weekly highs and lows
- Blue Channel: Monthly highs and lows
- Dynamic Updates: Channels adjust automatically when new highs or lows are formed.
- Support & Resistance Levels: High-probability zones for entries, exits, and reversals.
- All-Timeframe Compatibility: Works seamlessly on intraday and higher timeframe charts.
How to Trade Using DWM Channels
- Support & Resistance Strategy:
- Enter buy trades when price approaches a lower channel and shows signs of reversal.
- Enter sell trades when price reaches an upper channel and shows rejection.
- Breakout Strategy:
- If price breaks above or below a channel, it may signal a trend continuation.
- Confirm breakouts using Price Action and candlestick patterns.
- Multi-Timeframe Advantage:
- Use higher timeframe channels to determine the overall trend.
- Refine entries on lower timeframes for better precision.
Benefits of DWM Channels Indicator
- Provides clear higher timeframe levels on one chart.
- Improves trade accuracy using strong support and resistance zones.
- Suitable for both short-term and long-term trading strategies.
- Easy to use for beginners and advanced traders alike.
Conclusion
The DWM Channels Indicator for MT4 is an essential tool for traders who rely on multi-timeframe analysis. By plotting daily, weekly, and monthly channels on a single chart, it offers valuable insights into key price levels and market structure. When combined with price action, it helps traders execute more precise and confident trades.
FAQ
Published:
Mar 29, 2026 06:10 AM
Category: