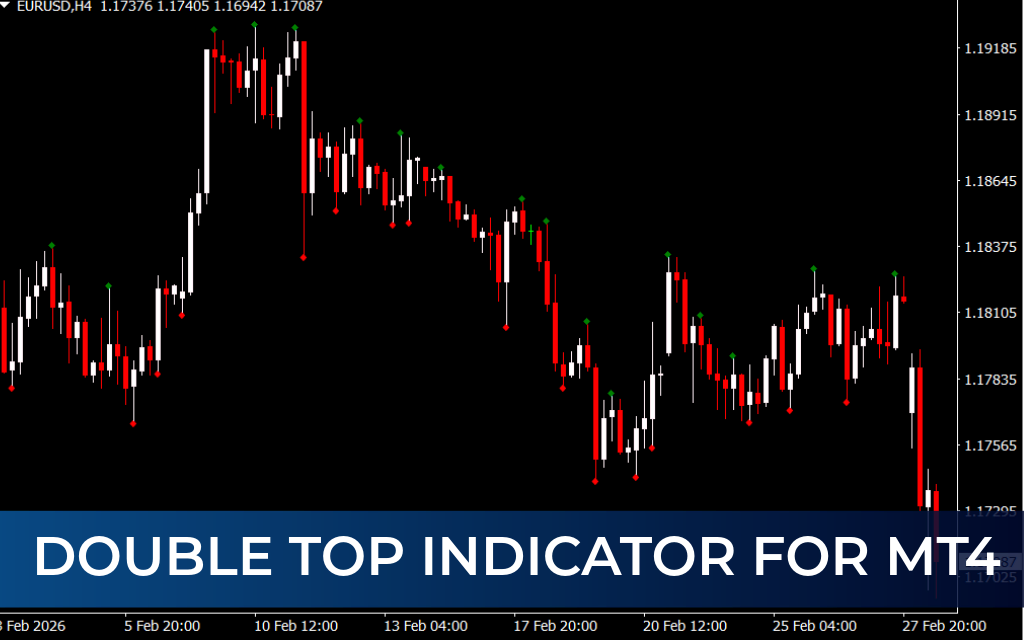
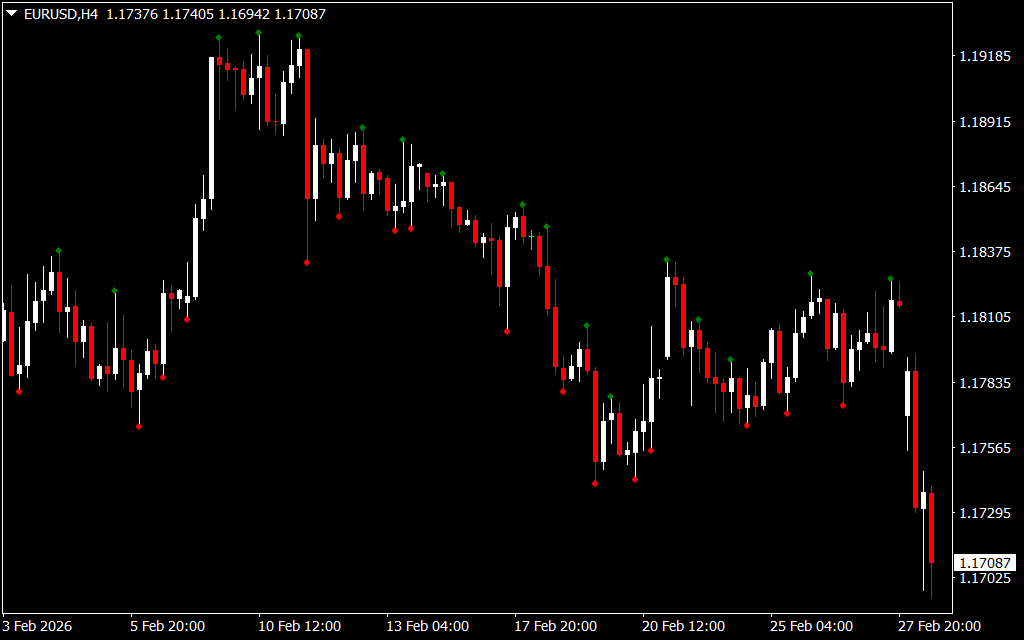
The Double Top Indicator for MetaTrader 4 is a technical analysis tool that highlights potential market reversals by plotting red and green diamonds on the chart. It simplifies the detection of double-top and double-bottom price formations, making trend reversals easier to spot.
How the Double Top Indicator Works
- Green Diamonds – Plotted above price bars during an uptrend, indicating higher highs and higher lows, signaling a potential reversal from bearish to bullish.
- Red Diamonds – Plotted during a downtrend, marking lower lows and lower highs, signaling a potential reversal from bullish to bearish.
The indicator is based on the classic double-top/double-bottom price patterns, which form when the price tests a level twice and fails to break through, signaling trend exhaustion.
How to Use the Double Top Indicator for MT4
- Apply the indicator to any timeframe (longer timeframes are recommended for more reliable signals).
- Observe the plotted diamonds:
- Green diamond → Possible reversal from a downtrend to uptrend.
- Red diamond → Possible reversal from an uptrend to downtrend.
- For precise trade entries, combine the indicator with other tools:
- RSI for overbought/oversold confirmation
- Trendlines to validate breakout or rejection
- Support And Resistance levels for stronger reversal zones
The indicator does not generate buy/sell signals on its own—it is primarily a Trend Reversal alert tool.
Benefits of the Double Top Indicator
- Visually identifies market reversal points using diamonds
- Can be applied on any timeframe, works best on higher timeframes
- Simplifies spotting double-top and double-bottom patterns
- Supports risk management by alerting potential reversals before major moves
- Useful for swing, intraday, and day traders
Conclusion
The Double Top Indicator for MT4 provides a clear visualization of potential trend reversals using red and green diamonds. While it does not issue direct trade signals, it is highly effective when combined with other technical analysis tools to anticipate bullish or bearish market moves.
FAQ
4 Downloads
Published:
Mar 02, 2026 09:22 AM
Category: