The DeMark Indicator for MT4 is a powerful trend-following tool that helps traders identify the direction of market trends. By plotting a trendline based on the comparison of current and previous bar highs and lows, the indicator highlights potential BUY and SELL opportunities.
It is particularly effective for long-term trading, allowing traders to better understand overall market tendencies. The indicator can be applied to any timeframe, though it performs best on longer periods, and it can be combined with other indicators like RSI, Parabolic SAR, and Linear Regression for enhanced accuracy.
What Is the DeMark Indicator?
The DeMark Indicator measures market trends by comparing:
- Current period highs and lows
- Previous period highs and lows
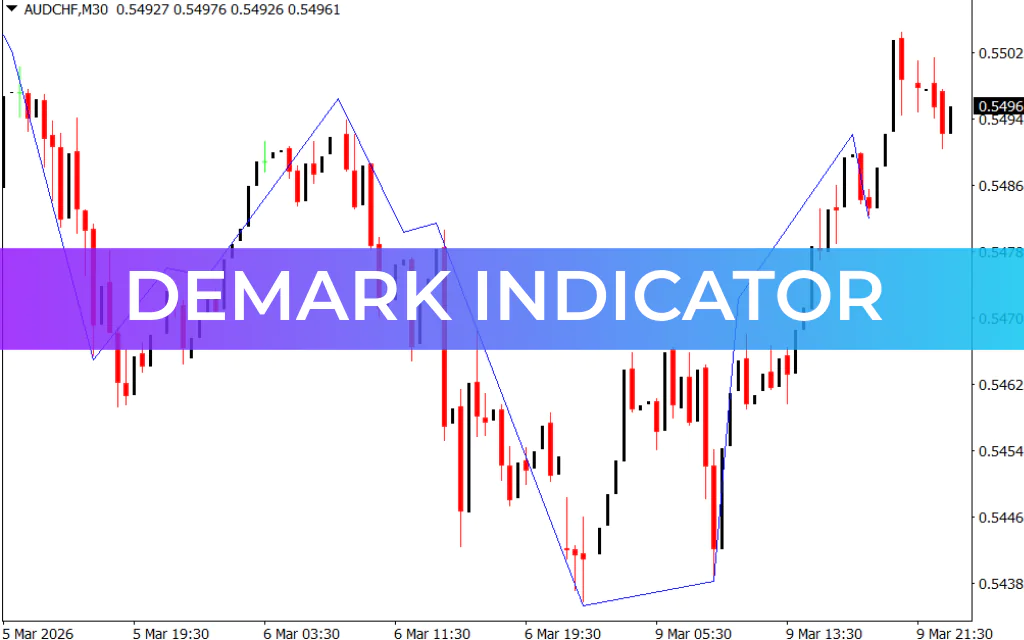
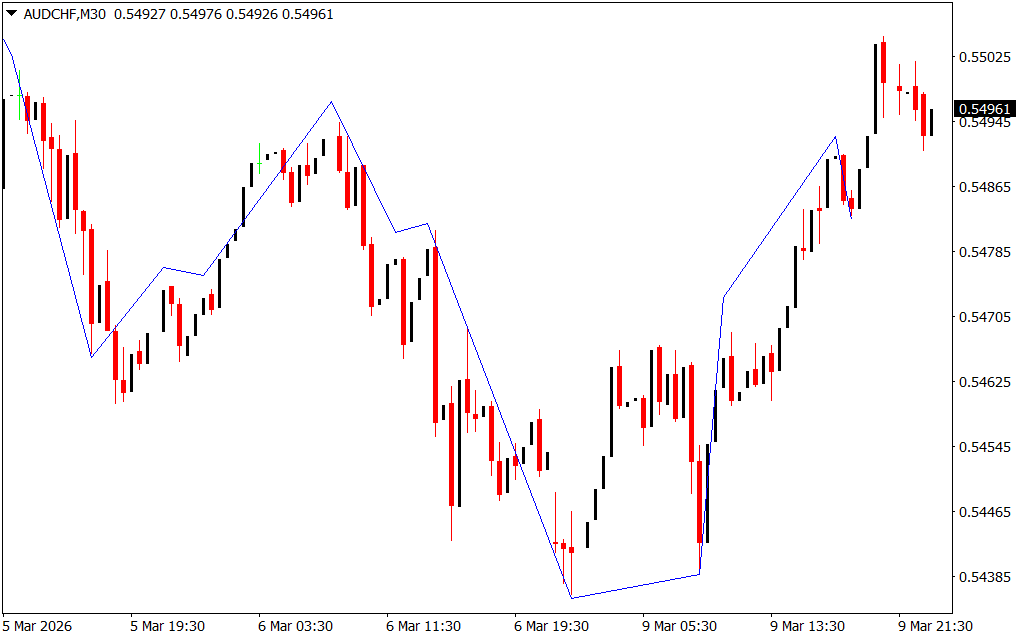
It then plots a dynamic trendline on the chart to illustrate the direction of the market. Traders can quickly gauge whether the market is bullish or bearish and make more informed trading decisions.
How the DeMark Indicator Works
The indicator works by displaying:
- Bars representing each trading period
- A blue trendline that fluctuates according to price movements
BUY Signal
- When the price falls below the blue trendline, it signals potential upward momentum.
- Traders may consider opening a BUY/LONG position after confirming with other indicators or Price Action.
SELL Signal
- When the price moves above the blue trendline, it indicates potential downward momentum.
- Traders may consider opening a SELL/SHORT position with additional confirmation.
Key Features of the DeMark Indicator
- Highlights trend direction using a dynamic trendline
- Shows BUY and SELL opportunities based on price movements
- Can be used across all timeframes, with optimal performance on longer charts
- Compatible with other technical indicators like RSI, Parabolic SAR, and Linear Regression
- Easy to interpret and beginner-friendly
Best Practices
- Use alongside Trend Confirmation tools to improve accuracy
- Apply proper risk management, including stop-loss and take-profit levels
- Avoid relying solely on the indicator for trading decisions; use it as a trend confirmation tool
Conclusion
The DeMark Indicator for MT4 is a reliable tool for traders who want to analyze trends and locate high-probability trade opportunities. By plotting a dynamic trendline based on price comparisons, it simplifies trade analysis and highlights BUY and SELL signals.
You can download the DeMark Indicator for MT4 for free and use it to enhance your forex trading strategy.
FAQ
2 Downloads
Published:
Mar 09, 2026 18:45 PM
Category: