The Delta V2 Indicator for MetaTrader 4 is a volume-based technical analysis tool designed to measure the difference between buyer and seller pressure. By calculating delta volume, the indicator helps traders determine trend direction and detect early signs of momentum shifts.
Because it highlights divergence and convergence patterns, the Delta V2 Indicator is considered a leading indicator that can provide early warnings of weakening trends and potential reversals.
It is easy to interpret and suitable for both beginner and advanced forex traders.
How the Delta V2 Indicator Works
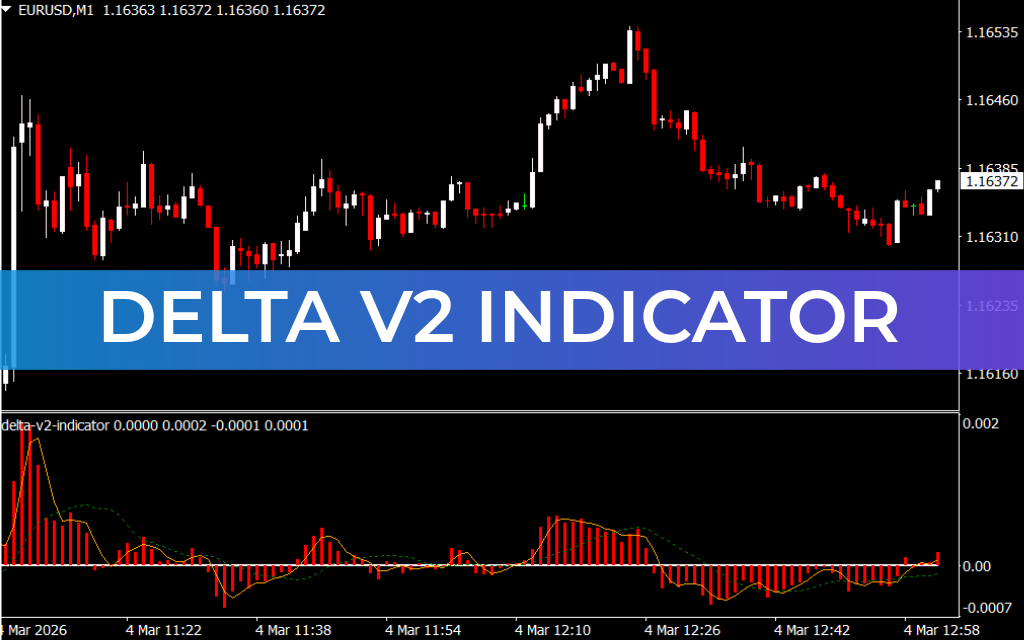
The indicator analyzes the imbalance between buying and selling volume and displays the data using:
- Histogram bars – Show bullish or bearish volume dominance
- Signal line – Confirms momentum direction
- Dotted reference line – Adds trend validation
Together, these components provide a structured view of market sentiment and Trend Strength.
Delta V2 Indicator Trading Signals
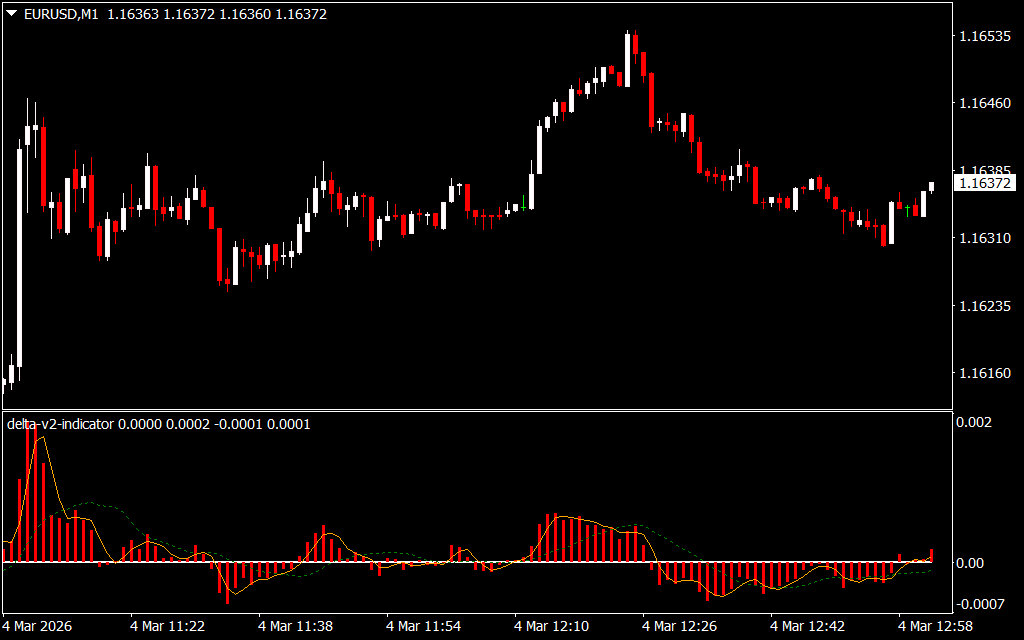
When applied to a chart such as GBPUSD on the H1 timeframe, the Delta V2 Indicator generates multiple trade setups.
Bullish Signal (Buy Setup)
A bullish trend is confirmed when:
- The histogram crosses above the zero line
- The signal line moves above the dotted line
This indicates strong buyer dominance. Traders may enter a buy trade and consider placing a stop loss below the previous swing low.
Bearish Signal (Sell Setup)
A bearish trend is identified when:
- The histogram crosses below the zero line
- The signal line drops below the dotted line
This suggests increasing selling pressure. Traders may open a sell position with appropriate risk management.
Divergence and Convergence Signals
Beyond crossover signals, traders can monitor divergence and convergence between Price Action and the histogram:
- Bullish Divergence: Price forms lower lows while the histogram forms higher lows — signaling a possible upward reversal.
- Bearish Divergence: Price forms higher highs while the histogram forms lower highs — indicating a potential downward reversal.
These setups often provide early Trend Reversal opportunities.
Why Use the Delta V2 Indicator?
- Measures real-time buyer vs. seller strength
- Provides early warning of trend weakness
- Combines histogram, signal line, and confirmation line
- Works across all chart timeframes
- Suitable for trend followers and reversal traders
Conclusion
The Delta V2 Indicator for MT4 is a powerful volume-based trading tool that helps forex traders identify market direction by analyzing buy and sell pressure. The combination of histogram signals, crossover confirmation, and divergence analysis makes it a valuable addition to any technical trading strategy.
It is practical, versatile, and free to download.
FAQ
2 Downloads
Published:
Mar 04, 2026 07:03 AM
Category: