Free
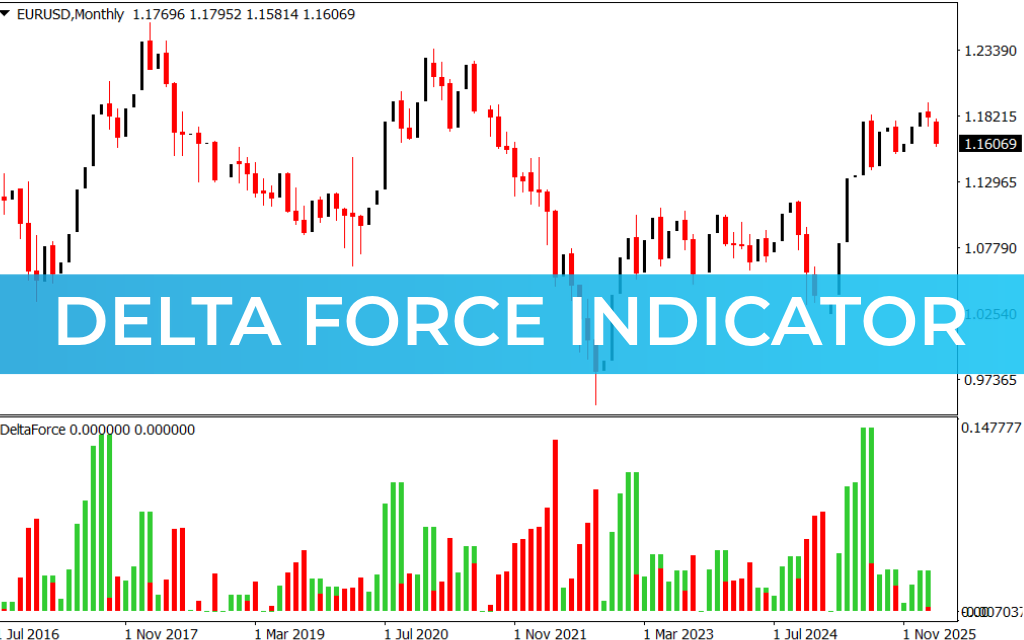
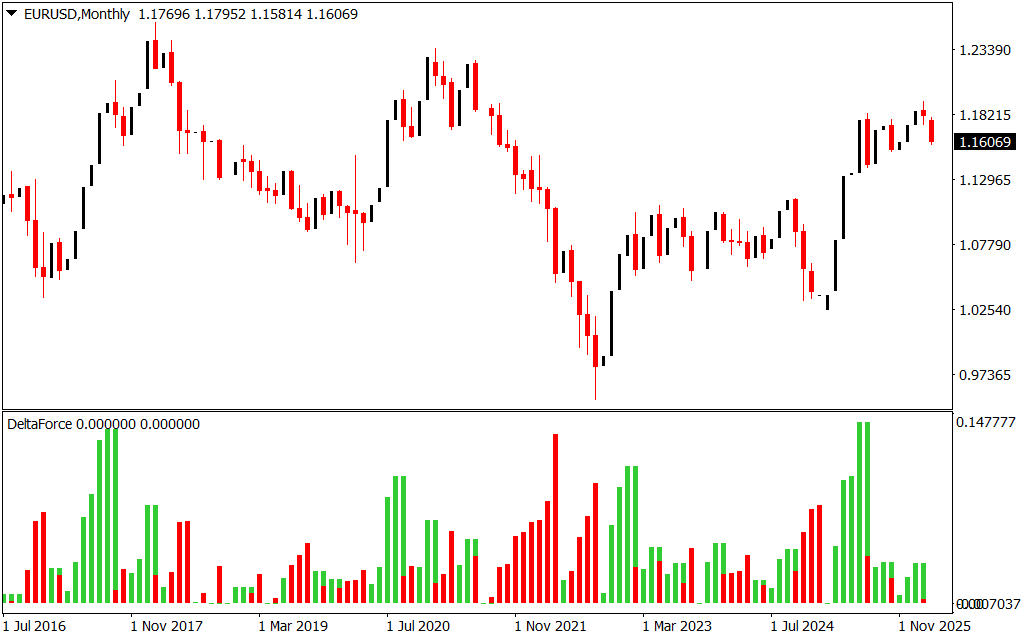
The Delta Force Indicator for MetaTrader 4 is a volatility-focused tool designed to identify potential Trend Reversal zones in financial markets. By analyzing previous extreme price levels where market momentum slowed, this indicator helps traders spot overextended conditions before a reversal occurs.
Key Features of the Delta Force Indicator
- Volatility Detection: Identifies extreme zones where price is overstretched.
- Histogram Signals:
- Green bars indicate bullish overextension and a potential reversal downward.
- Red bars indicate bearish exhaustion and a possible reversal upward.
- Trend Reversal Probability: Longer histogram bars suggest a higher likelihood of reversal.
- Trading Style: Best suited for Scalping, day trading, and intraday strategies.
How to Use the Delta Force Indicator on MT4
- Bullish Reversal:
- Observe red histogram bars forming at a price low.
- Consider entering a long position after confirmation of trend continuation or minor retracement.
- Bearish Reversal:
- Observe green histogram bars forming at a price high.
- Look for shorting opportunities after minor retracements in an uptrend.
- Trend Context:
- Signals are most reliable during trending markets, helping identify exhaustion points for entries.
- Avoid relying solely on the indicator during consolidating or sideways markets.
Tips for Optimal Trading
- Use the indicator alongside trend-following tools to confirm reversal setups.
- Best applied on intraday and day trading timeframes for volatility-sensitive entries.
- Ideal for traders who want to capture trend reversals and corrective moves in forex and other financial markets.
Conclusion
The Delta Force Indicator for MT4 is a technical tool that tracks price elasticity and highlights potential trend reversal zones. By providing clear overextension signals, it is particularly useful for scalpers and intraday traders seeking high-probability trading opportunities.
FAQ
Volatility-focused. Analyzes previous extreme price levels where momentum slowed. Green bars = bullish overextension, potential reversal downward. Red bars = bearish exhaustion, potential reversal upward. Longer bars = higher likelihood of reversal.
Red histogram bars forming at price low. Consider long after confirmation of trend continuation or minor retracement.
Green histogram bars forming at price high. Consider short after confirmation.
Best for scalping, day trading, intraday. Volatility traders. MT4.
Overextended conditions. Reversal zones. Before reversal occurs.
4 Downloads
Published:
Mar 03, 2026 07:57 AM
Category:
Share: